Previous Trading Day’s Events (27.06.2024)
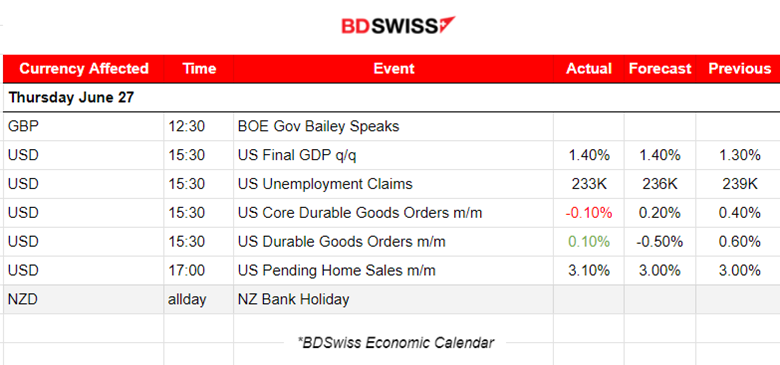
Business spending on equipment is under pressure from higher interest rates and softening demand for goods.
The Federal Reserve has maintained its benchmark overnight interest rate in the current 5.25%-5.50% range since last July. Financial markets expect the U.S. central bank to start its easing cycle in September, though policymakers recently adopted a more hawkish outlook.
Source: https://www.reuters.com/markets/us/us-core-capital-goods-orders-fall-sharply-may-2024-06-27/
______________________________________________________________________
Winners vs Losers
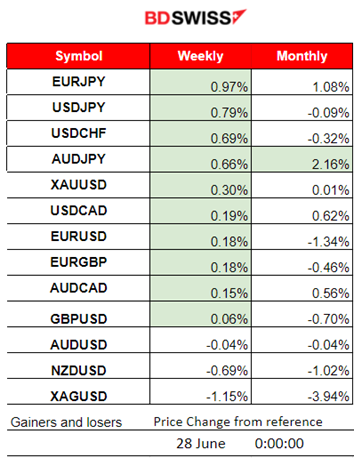
JPY pairs ( JPY as quote currency) jump to the top as the JPY suffers a strong weakening. The U.S. dollar is remaining strong. AUDJPY leads this month with 2.16% gains so far.
 ______________________________________________________________________
News Reports Monitor – Previous Trading Day (27.06.2024)
Server Time / Timezone EEST (UTC+03:00)
- Midnight – Night Session (Asian)
No important news announcements, no important scheduled releases.
- Morning – Day Session (European and N. American Session)
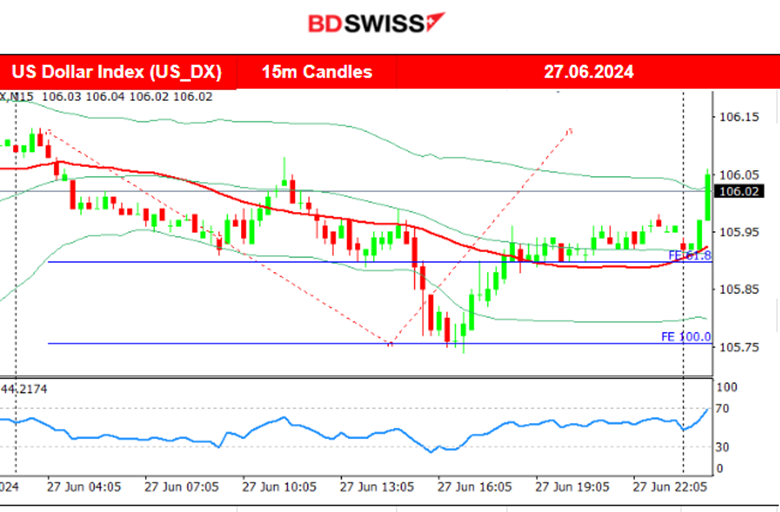
At 15:30 the Real gross domestic product (GDP) figure increased at an annual rate of 1.4% in the first quarter of 2024. In the fourth quarter of 2023, real GDP increased 3.4%. Unemployment claims were reported 3K lower, not much lower than the forecast. Core durable goods orders monthly figure was a decline, surprising the markets, however, durable goods have shown lower growth, down to 0.10% from 0.6%. Pending home sales growth was reported as higher than expected. Overall the dollar depreciated but not much from the releases. Volatility remained moderate.
General Verdict:
 __________________________________________________________________
FOREX MARKETS MONITOR
EURUSD (27.06.2024) 15m Chart Summary
Server Time / Timezone EEST (UTC+03:00)
Price Movement
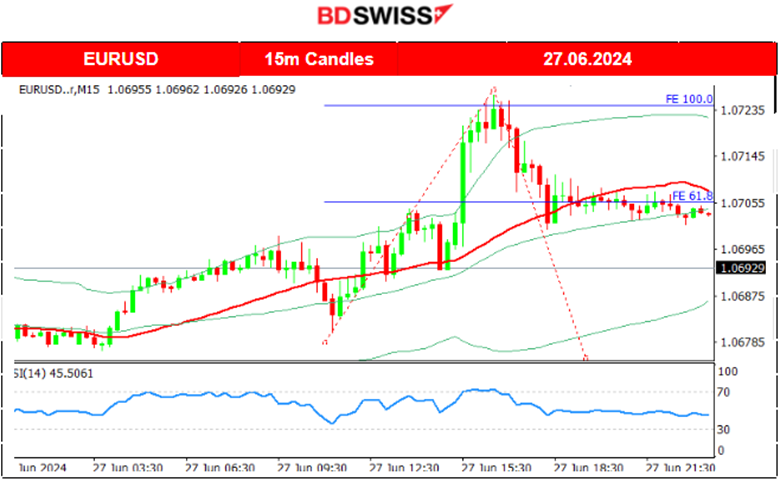
The pair moved to the upside early, driven by USD depreciation. After reaching a peak at near 1.07235 it reversed to the downside, as USD started to appreciate since the news release, returning to the 30-period MA.
 ___________________________________________________________________
CRYPTO MARKETS MONITOR
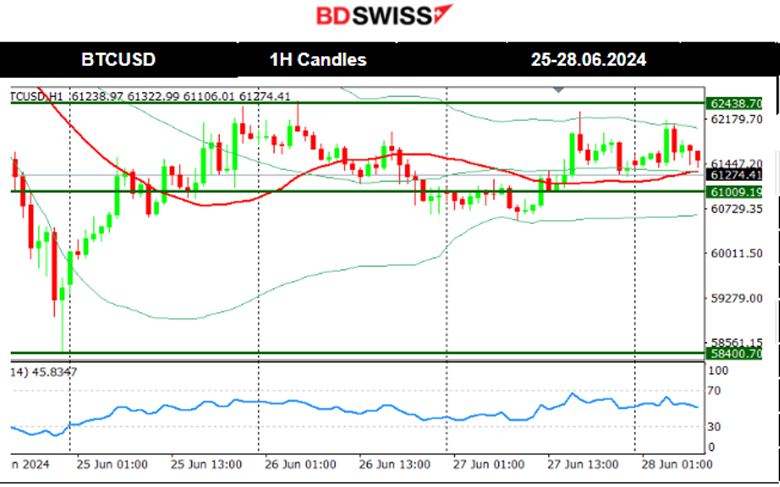
BTCUSD (Bitcoin) Chart Summary 1H
Server Time / Timezone EEST (UTC+03:00)
Price Movement
On the 20th, the price moved to the upside breaking the upper band of a triangle formation and stalled at 65,500 USD. That changed on the 21st when the price moved lower quite aggressively, reaching the support at 63,430 USD before retracing and settling to 64K USD. During the weekend, volatility lowered but yesterday, 24th of June, Monday, Bitcoin plunged to 58,400 before retracing to the 61.8 Fibo level and settling near the 30-period MA, very close to 61K USD for now. Not too much volatility currently as the price is moving around the MA. The price is above the 30-period MA but generally stays settled at the 61K USD level for now.
 Crypto sorted by Highest Market Cap:
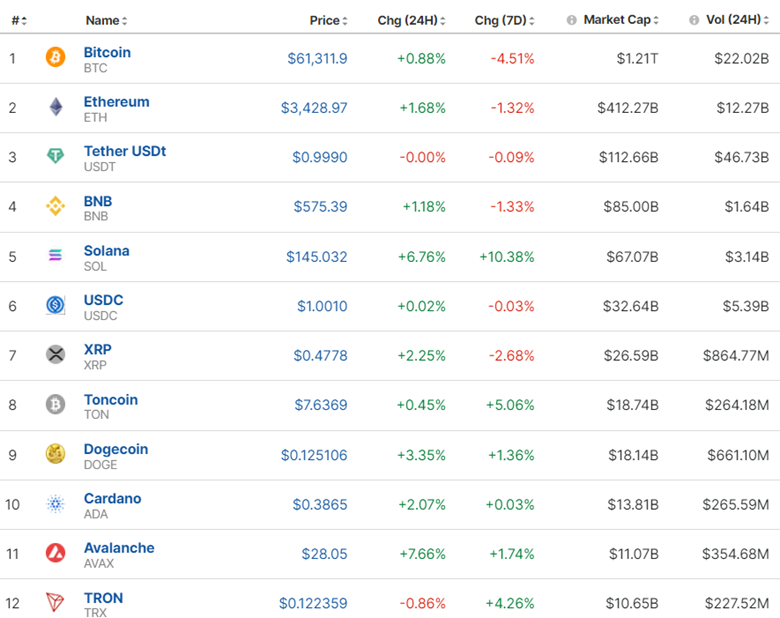
The Crypto Market is still suffering. Bitcoin remains low close to 61K USD. Volatility lowered as we approached the end of the week.
https://www.investing.com/crypto/currencies
______________________________________________________________________
EQUITY MARKETS MONITOR
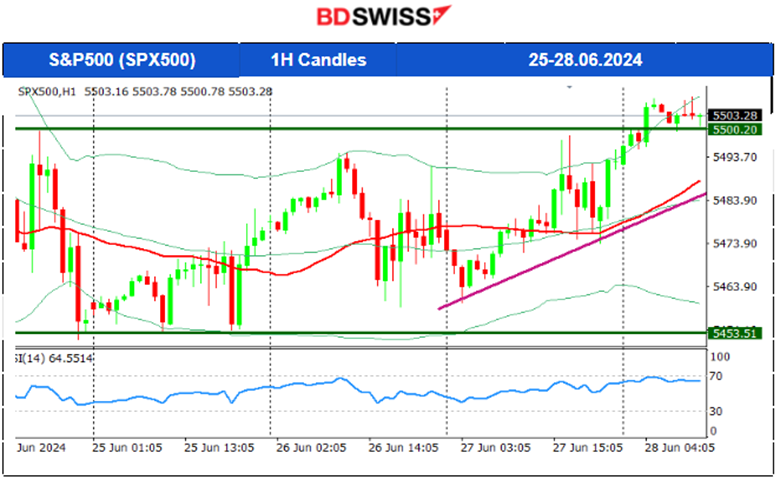
S&P500 (SPX500) 4-Day Chart Summary
Server Time / Timezone EEST (UTC+03:00)
Price Movement
On the 26th, the index tested the resistance near 5,496 without success and retraced to the MA continuing the path sideways. On the 28th breakout of the 5,500 resistance led finally to an upward movement continuation of the index. It is Friday and upon stock exchange opening retracement is possible. However, the 5,500 USD level should act as a strong support.
 ______________________________________________________________________
COMMODITIES MARKETS MONITOR
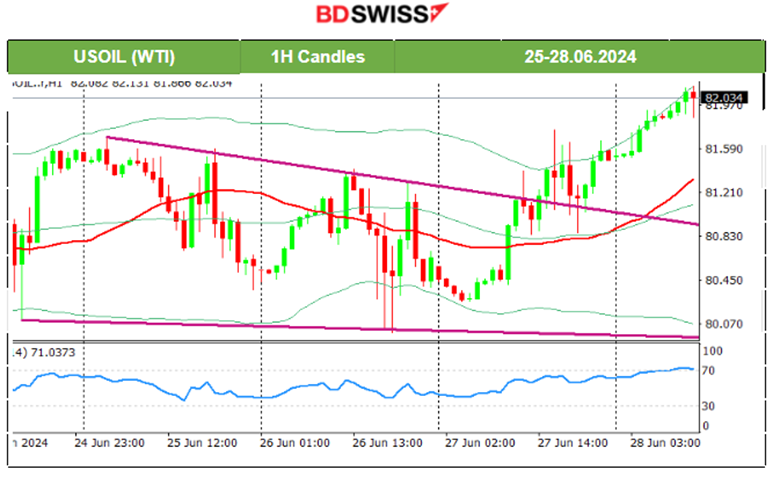
USOIL (WTI) 4-Day Chart Summary
Server Time / Timezone EEST (UTC+03:00)
Price Movement
On the 26th the price tested the support near 80 USD/b without success and retraced back to the MA. Max near 1 USD deviation from the mean. On the 27th however the resistance at 81.7 USD/b broke and Crude oil got a boost, passing the 82 USD/b. The RSI does not provide any signals for a retracement yet.
 XAUUSD (Gold) 4-Day Chart Summary
Server Time / Timezone EEST (UTC+03:00)
Price Movement
On the 25th, the price dropped after breaking a triangle formation and moved lower, remaining below the 30-period MA. The trend eventually continued and Gold moved to the downside. USD appreciation helped. On the 26th the price broke important support levels and moved lower rapidly to 2,293 USD/oz before retracement took place and settled at 2,300 USD/oz. A triangle breach on the 27th caused it to jump and it seems that the momentum is high enough for the price to break further resistance levels, i.e. 2,330 USD/oz.
 ______________________________________________________________
News Reports Monitor – Today Trading Day (28.06.2024)
Server Time / Timezone EEST (UTC+03:00)

- Midnight – Night Session (Asian)
No important news announcements, no important scheduled releases.
- Morning – Day Session (European and N. American Session)
At 15:30 the Canada GDP monthly figure will be released and is expected to reach higher at 0.3%. The CAD pairs will probably be affected by a moderate shock.
At the same time, the PCE price Index figure for the U.S. will potentially shake the USD pairs as the market has eyes on inflation-related indices. The expected monthly figure is lower at 0.1%. That’s quite optimistic for inflation considering that recent major regions like Canada and Australia experienced higher prices. A surprise in the figure is something to expect.
General Verdict:
______________________________________________________________


