Previous Trading Day’s Events (26.03.2024)
“The data suggest that business equipment investment is beginning to recover, and with corporate bond yields likely to fall a little further over the coming months while manufacturing activity appears to be picking up again, we suspect that recovery has further to run,” said Andrew Hunter, deputy chief U.S. economist at Capital Economics.
Orders for durable goods rose 1.4% last month, the Commerce Department’s Census Bureau said. Orders advanced 1.8% on a year-on-year basis in February.
Consumers are noticing the economy’s resilience, though that is being eclipsed by rising worries over the upcoming election. In a separate report, the conference board said its consumer confidence index was little changed at 104.7 in March.
“Recession fears continued to trend downward,” said Dana Peterson, chief economist at the conference board. “Meanwhile, consumers expressed more concern about the U.S. political environment compared to prior months.”
Source:
https://www.reuters.com/markets/us/us-durable-goods-orders-rebound-february-2024-03-26/
______________________________________________________________________
Winners vs Losers
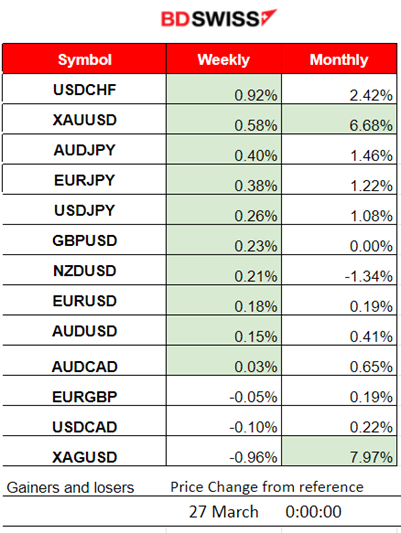
USDCHF reaches the top of the winner’s list for the week as the dollar recovers. Gold remains second from the top of the month’s gainers list with 6.68%. Silver leads with 7.97% gains.
 ______________________________________________________________________
News Reports Monitor – Previous Trading Day (26 Mar 2024)
Server Time / Timezone EEST (UTC+02:00)
- Midnight – Night Session (Asian)
No important news announcements, no special scheduled releases.
- Morning – Day Session (European and N. American Session)
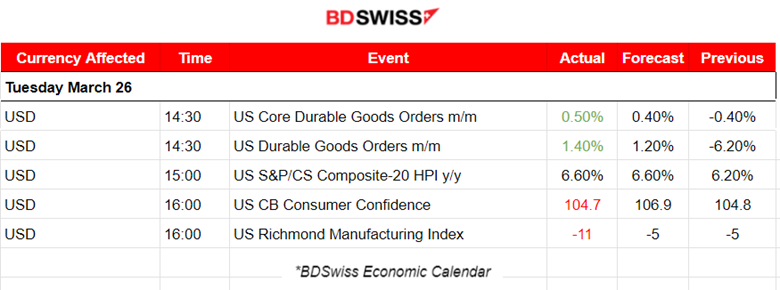
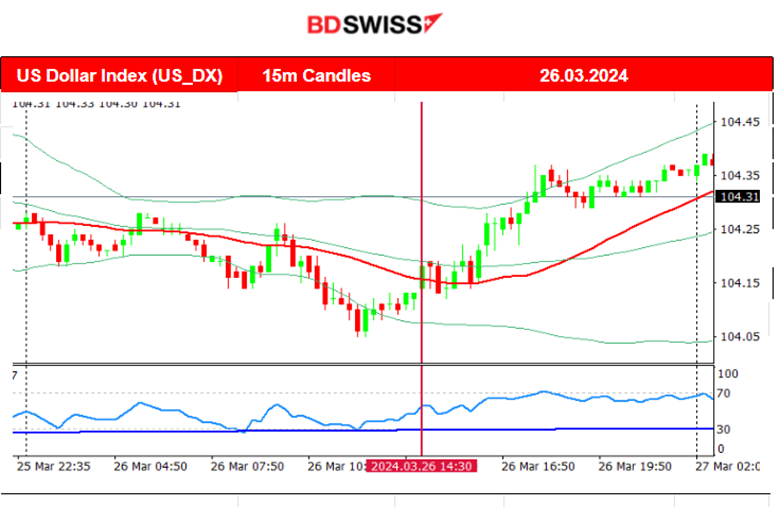
The U.S. durable goods figures showed that the number of orders in the United States rose by 1.4%, higher than expected. Transportation equipment led the increase, up 3.3% in comparison to the previous month. Not a major impact on the market though.
The CB consumer confidence at US consumer confidence held steady in March. Americans grew slightly more pessimistic about the outlook. The conference board’s gauge of sentiment ticked down to 104.7 from a downwardly revised 104.8 a month earlier. A measure of expectations fell to 73.8, the lowest since October, while the gauge of current conditions picked up to 151. The average anticipated inflation rate over the next 12 months held near the lowest level in four years.
General Verdict:
 __________________________________________________________________
FOREX MARKETS MONITOR
EURUSD (26.03.2024) 15m Chart Summary
Server Time / Timezone EEST (UTC+02:00)
Price Movement
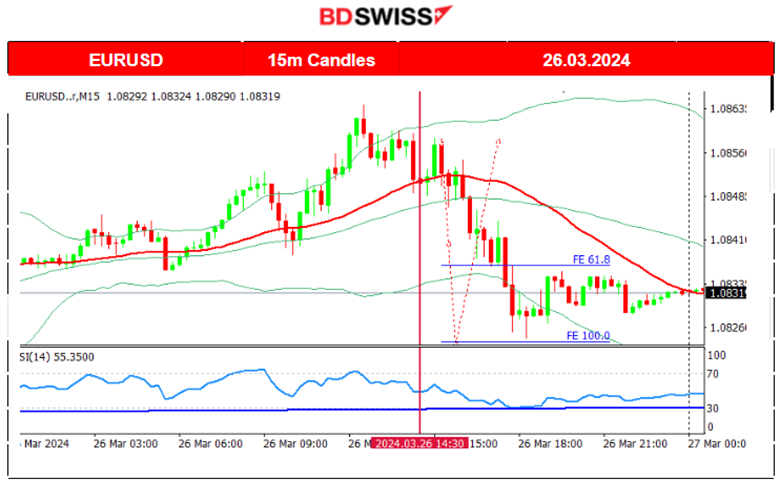
The pair moved to the upside early as the dollar was experiencing depreciation until 14:30. After that the U.S. news was released causing dollar appreciation and a rapid drop for the EURUSD until the support near 1.08240 before retarcement took place. Durable goods figures probably had a positive impact on the dollar.
 ___________________________________________________________________
CRYPTO MARKETS MONITOR
BTCUSD (Bitcoin) Chart Summary 1H
Server Time / Timezone EEST (UTC+02:00)
Price Movement
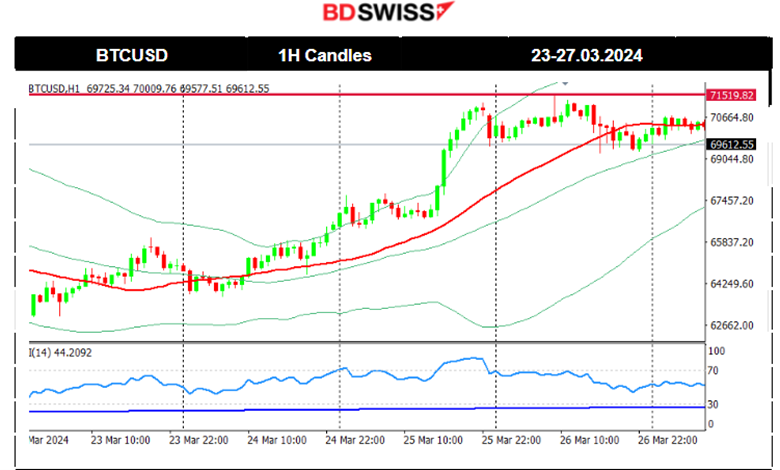
Bitcoin suffered losses recently dropping from the peak at 74K, and continuing downwards until the FOMC event. After the news and during the press conference, Bitcoin saw a rise, returning back to the mean.
The 10 US spot bitcoin ETFs collectively saw net outflows each day last week and those net outflows slowed later in the week.
Since the 22nd of March, it actually experienced a good comeback with the price moving upwards crossing the 30-period MA on its way up and showing upward momentum. The 68K USD level resistance was breached on the 25th of March and the price moved higher even beyond 70K USD. Currently, the price is moving sideways as Bitcoin settled around 71K USD.
 Crypto sorted by Highest Market Cap:

Crypto assets could see further corrections and even higher performance as the halving event is near. However, more inflows should be in place for this to happen. Currently, we do not see any significant inflows.
Source: https://www.investing.com/crypto/currencies
______________________________________________________________________
EQUITY MARKETS MONITOR
NAS100 (NDX) 4-Day Chart Summary
Server Time / Timezone EEST (UTC+02:00)
Price Movement
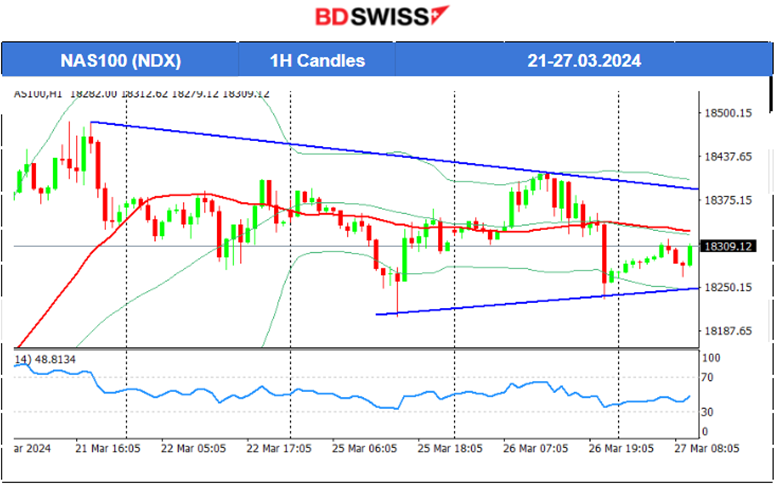
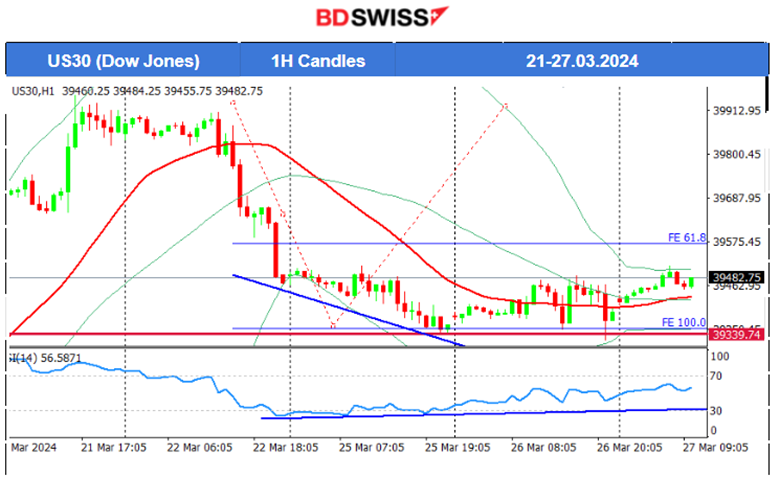
After the FOMC event on the 20th of March, all U.S. indices saw a jump. The market’s initial expectation was that borrowing costs would lower soon or as expected this year, sparking this upward movement and resilience to the downside. Soon, however, expectations changed. The dollar saw massive strengthening and the U.S. indices started to drop since the 21st March. The Dow Jones fell rapidly from the 21st March’s peak near 40,000 down to 39,500 USD. Indices currently remain sideways, around a slightly falling 30-period MA except for the Dow Jones (US30) that saw a rapid fall on the 22nd of March and continued later with a sideways movement around the mean.
 US30 (Dow Jones) 4-Day Chart Summary
Server Time / Timezone EEST (UTC+02:00)
 ______________________________________________________________________
COMMODITIES MARKETS MONITOR
USOIL (WTI) 4-Day Chart Summary
Server Time / Timezone EEST (UTC+02:00)
Price Movement
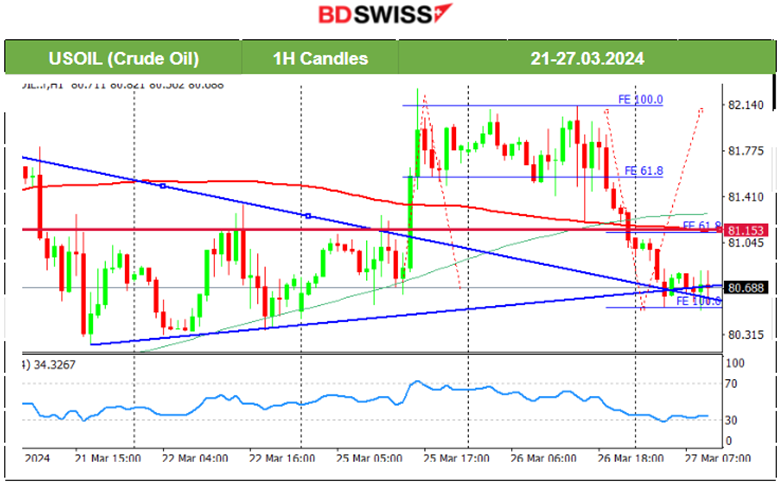
Crude oil found a peak at 83 USD/b on the 19th of March and then retraced to near 80 USD/b following the FOMC. As mentioned in our previous analysis, the price eventually moved above the 30-period MA on the 25th of March. The bullish divergence is completed and at the same time, a triangle formation was breached as depicted on the chart. Crude oil moved to 82.3 USD/b before retracement followed. After some consolidation period, the price moved to the downside rapidly with a reversal from the upside. This rapid downward movement boosts the probability of a retracement taking place today. The target level should be near 81.15 USD/b (61.8 Fibo). An alternative scenario would be that the price breaks the support near 80.4 leading to the next support at 80 USD/b.
 XAUUSD (Gold) 4-Day Chart Summary
Server Time / Timezone EEST (UTC+02:00)
Price Movement
FOMC: Powell decided yesterday to ignore the inflation data and their statements gave even a hint that rate cuts will proceed as expected. Gold Jumped near 65 USD as the USD depreciated heavily during the press conference. The dollar showed unusual strength after the FOMC event causing Gold to wipe out the gains since the FOMC news. Since the 21st of March Gold moved below the 30-period MA and remained on a downtrend until the 25th of March where it settled near the mean at 2170 USD/oz. As predicted in our previous analysis, the breakout of the triangle caused a jump in Gold’s price to 2200 USD/oz. Intraday reversal followed and Gold settled eventually at near 2180 USD/oz.
 ______________________________________________________________
News Reports Monitor – Today Trading Day (26 Mar 2024)
Server Time / Timezone EEST (UTC+02:00)

- Midnight – Night Session (Asian)
Annual Inflation figures in Australia remained unchanged at 3.40%. The result was below the 3.6% level expected by markets. The market reacted with AUD depreciation starting at 2:00 at the time of the release. The AUDUSD dropped rapidly nearly 25 pips.
- Morning – Day Session (European and N. American Session)
The estimated annual inflation of the CPI in March 2024 is 3.2%, according to the flash indicator prepared by the NSI. No major impact was recorded in the market.
General Verdict:
______________________________________________________________


