PREVIOUS TRADING DAY EVENTS –08 Nov 2023
______________________________________________________________________
Winners and Losers

News Reports Monitor – Previous Trading Day (08 Nov 2023)
Server Time / Timezone EEST (UTC+02:00)
- Midnight – Night Session (Asian)
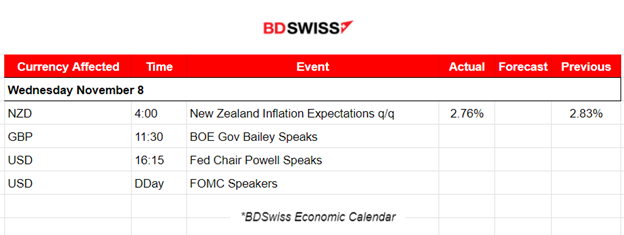
Respondents’ expectations for one-year ahead and two-year-ahead annual inflation have declined. Inflation expectations for the quarter were reported with a 2.76% figure versus the previous higher 2.83%. Annual CPI inflation for the September 2023 quarter was measured at 5.6%, a decline from last quarter’s 6.0% annual inflation. The five-year-ahead and ten-year-ahead annual inflation expectations increased from last quarter’s mean estimates and remained within the 1-3% inflation target. No major impact was recorded affecting the NZD pairs at the time of the report release.
- Morning–Day Session (European and N. American Session)
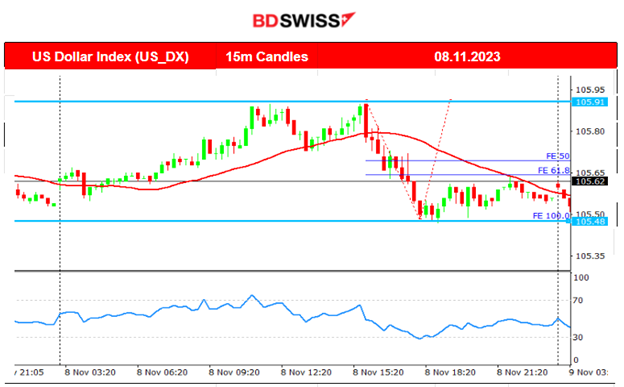
No major releases, no major news announcements. Several speeches take place from central bank representatives throughout the day.
General Verdict:
 ____________________________________________________________________
FOREX MARKETS MONITOR
EURUSD (08.11.2023) Chart Summary
Server Time / Timezone EEST (UTC+02:00)
Price Movement
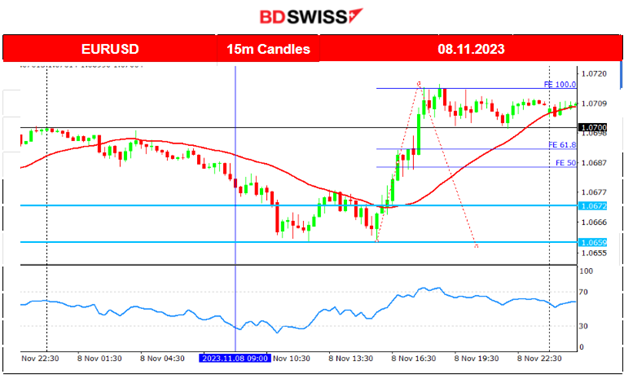
The pair moved lower when the European session was approaching and found support at 1.0659. The absence of important scheduled figures made it impossible for the pair to deviate much from the 30-period MA. It eventually reversed and moved to the upside, crossing the MA on its way up moving rapidly. It found strong resistance near 1.07160 before retracing back to the mean.
 ___________________________________________________________________
CRYPTO MARKETS MONITOR
BTCUSD (Bitcoin) 4-Day Chart Summary
Server Time / Timezone EEST (UTC+02:00)
Price Movement
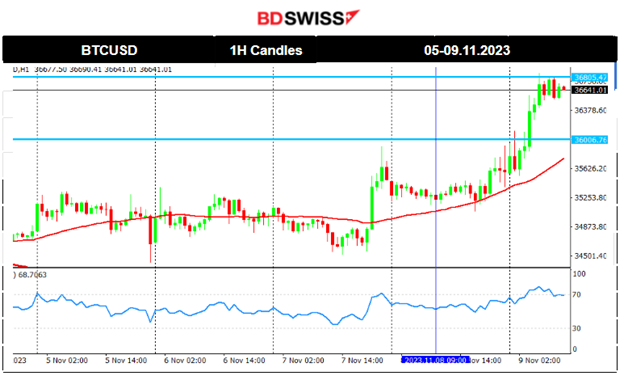
The 35400 resistance was critical for bitcoin. It eventually broke that resistance and almost touched the 36000 level on its way up after it saw a jump. The price soon retraced back to the 61.8% Fibo level and settled near the support levels that were previously acting as resistance levels near 35300. Today the price broke the 36000 resistance and jumped to the next level at near 36800. No retracement was recorded yet.
Crypto sorted by Highest Market Cap:
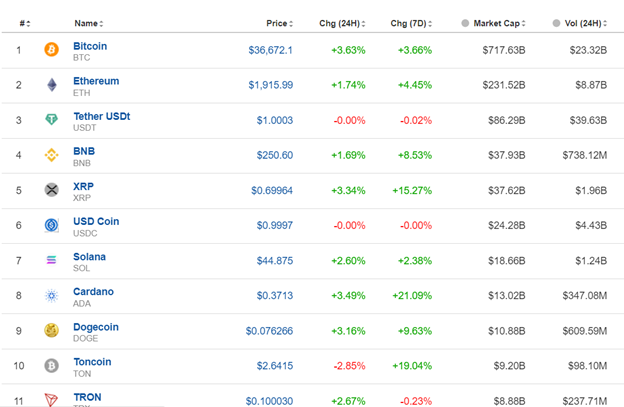
The crypto market is showing some good gains this week. Bitcoin is moving to the upside relatively quickly with 3.36% gains for the last 24 hours. Cardano remains on the top of the gainer’s list for the 7 days period with 21.10% gains so far.
Source: https://www.investing.com/crypto/currencies
______________________________________________________________________
EQUITY MARKETS MONITOR
NAS100 (NDX) 4-Day Chart Summary
Server Time / Timezone EEST (UTC+02:00)
Price Movement
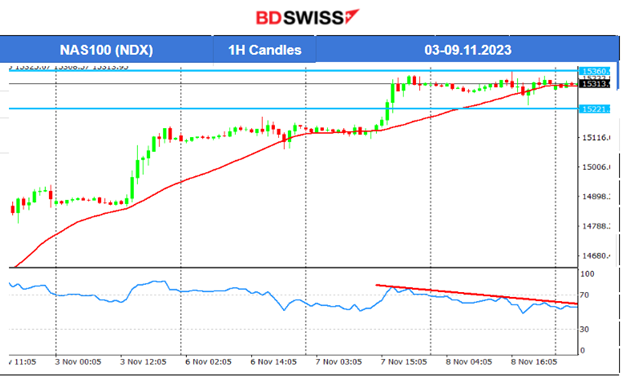
All benchmark U.S. indices have been experiencing the same path upwards lately. The RSI still shows lower highs, it is a matter of time before the market eventually retraces back. We will wait until we have more evidence that there is an end to this uptrend and support breakouts indicating a reversal and a long retracement for the price correction to the downside. Currently the indices follow a sideways path again with high volatility. Important resistance appears to be near 15360. 15220 acts as an important support and its breakout to the downside will probably indicate the long waited reversal/end of the uptrend.
 ______________________________________________________________________
COMMODITIES MARKETS MONITOR
USOIL (WTI) 4-Day Chart Summary
Server Time / Timezone EEST (UTC+02:00)
Price Movement
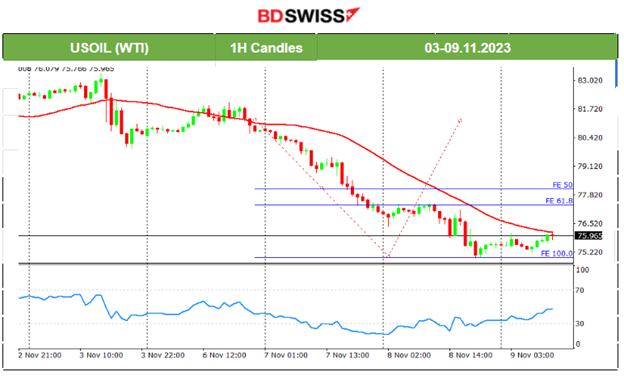
The price has experienced a sharp fall recently and strong support at near 77 USD/b was preventing the price from falling further. A breakout eventually occurred to the downside yesterday and the price dropped further rapidly until the next support at 75.5 USD/b and then at even 75 USD/b before retracing back to 76 USD/b. We are waiting to see if this will be the turning point with the price reversing upwards after a long drop. There is not enough evidence to suggest that though. We need more resistance breakouts. Let’s see.
TradingView Analysis
https://www.tradingview.com/chart/USOIL/uA8kUaQm-USOIL-Retracement-08-11-2023/
XAUUSD (Gold) 4-Day Chart Summary
Server Time / Timezone EEST (UTC+02:00)
Price Movement
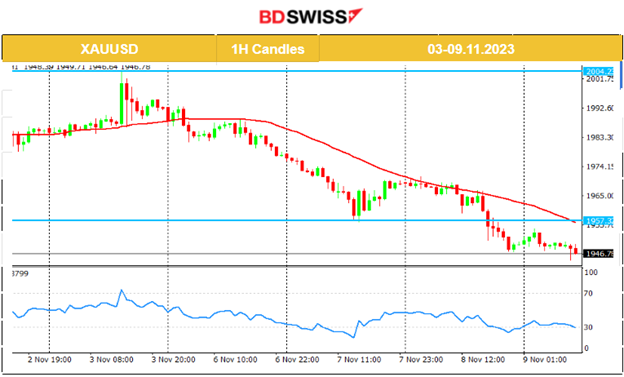
Gold jumped during the NFP report and immediately reversed to the downside with mean reversal. During the jump it reached the resistance at near 2004 UD/oz, however, it reversed lower and remained on the downside. Since then, we have had a clear downward trend. Even though the RSI shows signals of a bullish divergence (higher lows) there is not enough evidence that Gold eventually will change direction. 1940 USD/oz is probably the next support.
 ______________________________________________________________
News Reports Monitor – Today Trading Day (09 Nov 2023)
Server Time / Timezone EEST (UTC+02:00)
- Midnight – Night Session (Asian)
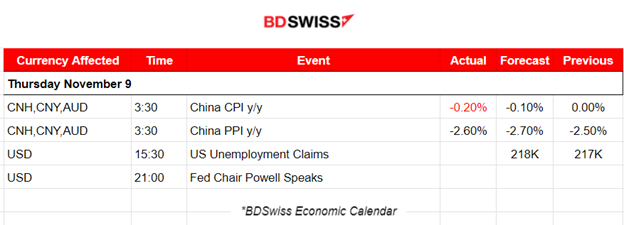
Inflation data for China show that it re-entered disinflationary territory in October. Both consumer (CPI) and producer (PPI) inflation contracted. The CPI inflation shrank at an annualised 0.2% in October, in line with expectations of a negative figure, and worsened from the 0% reading seen in September. No major shock was recorded at that time.
- Morning–Day Session (European and N. American Session)
The jobless claims for the U.S. will be released at 15:30 which is usually the time the USD sees more volatility. The figure is expected to be reported higher, something logical since we saw from the other labour data related figures that cooling of the labour market is apparent. Employment figures were reported way lower than expected.
No other major releases, no major news announcements. Several speeches take place from central bank representatives throughout the day.
General Verdict:
______________________________________________________________


