

Previous Trading Day’s Events (23 Feb 2024)
______________________________________________________________________
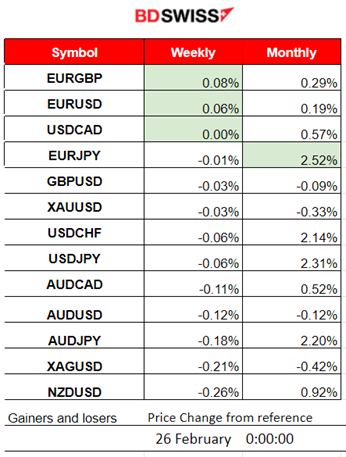
Winners vs Losers
EURGBP is on the top of the winner’s list for the week having 0.08% gains so far. The EURJPY is leading for this month with 2.52% gains.
 ______________________________________________________________________
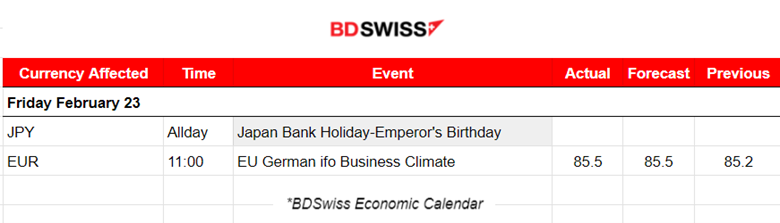
News Reports Monitor – Previous Trading Day (23 Feb 2024)
Server Time / Timezone EEST (UTC+02:00)
- Midnight – Night Session (Asian)
No important announcements, no special scheduled releases.
- Morning – Day Session (European and N. American Session)
No important announcements, no special scheduled releases.
General Verdict:
 ____________________________________________________________________
FOREX MARKETS MONITOR
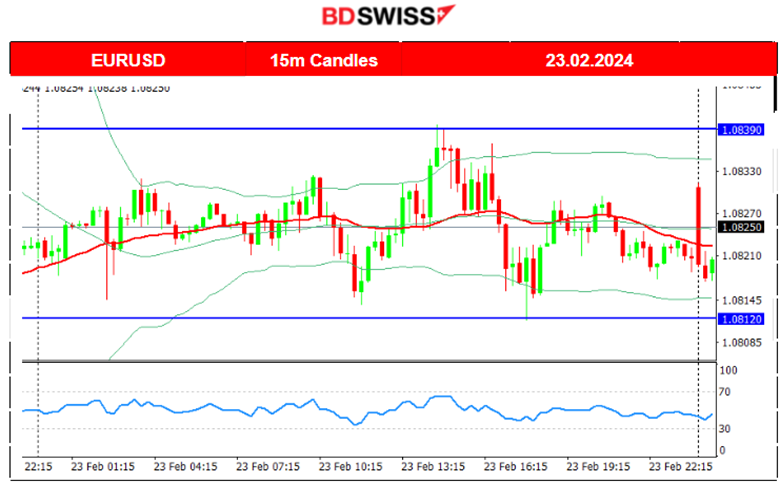
EURUSD (23.02.2024) 15m Chart Summary
Server Time / Timezone EEST (UTC+02:00)
Price Movement
With the absence of significant scheduled releases, the pair experienced low volatility throughout the whole trading day. It moved sideways around the mean experiencing more volatility and higher deviations from the 30-period MA after the start of the European session. The highest range in which the price moved was around 30 pips and the pair closed almost flat.
 ___________________________________________________________________
CRYPTO MARKETS MONITOR
BTCUSD (Bitcoin) Chart Summary
Server Time / Timezone EEST (UTC+02:00)
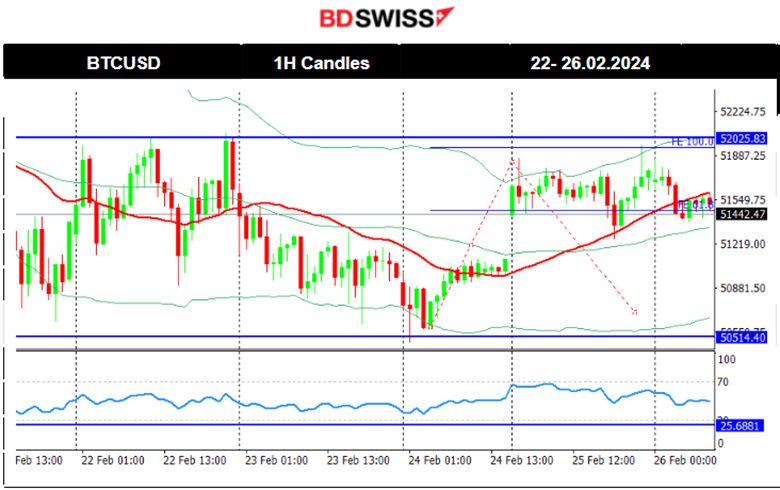
Price Movement
Bitcoin settled sideways for now but is governed with high volatility on its way around the 30-period MA. 52,000 USD seems to be the important resistance level. The support is apparently at 50,500 USD. On the 24th Feb, the price moved to the upside, reversing from the previous drop and after the retracement it settled near the 61.8 Fibo level near 51,450 USD. Considering recent data and its volatility, unless an important fundamental factor takes place, the price could move to the downside continuing the path around the MA, experiencing big deviations from it.
 Crypto sorted by Highest Market Cap:
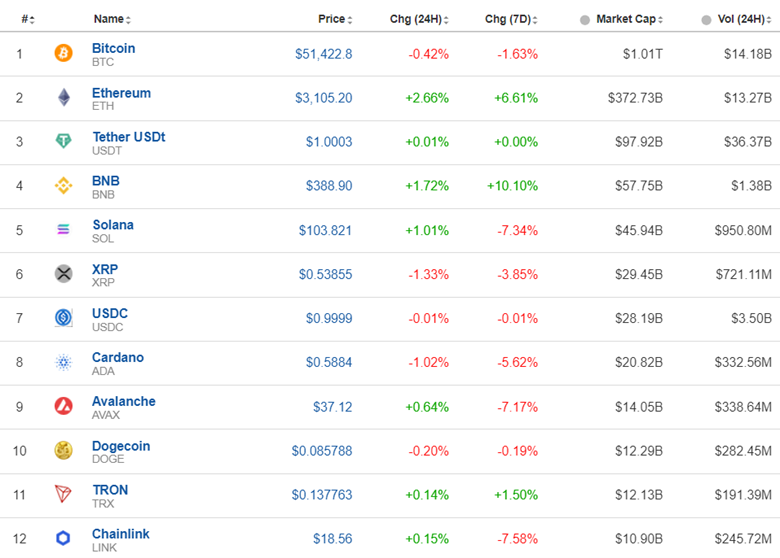
No important fundamental factors for now. This keeps the market stable and in range.
Source: https://www.investing.com/crypto/currencies
______________________________________________________________________
EQUITY MARKETS MONITOR
NAS100 (NDX) 4-Day Chart Summary
Server Time / Timezone EEST (UTC+02:00)
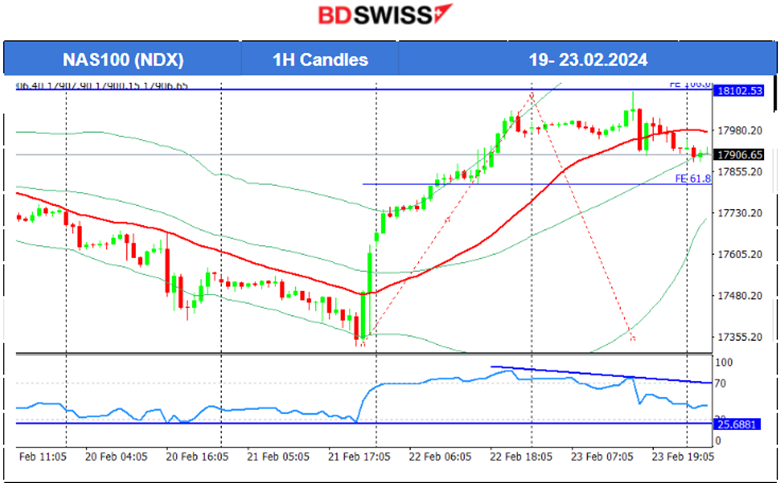
Price Movement
Global stocks rallied on the 21st Feb and after 22:00. All U.S. indices experienced a big jump to the upside. The tech-heavy Nasdaq 100 index jumped over 1.8%. The boss of Nvidia said artificial intelligence (AI) is at a “tipping point” as it announced record sales. It reported that revenues surged by 265% in the three months to 28th January, compared to a year earlier. On the 23rd Feb, the index moved to the upside further, breaking the 18,000 resistance level and reaching the one near the 18,100 USD before retracement took place. The RSI was showing bearish signals and according to the Fibo levels, it might drop lower to reach the 61.8 Fibo level. The other two benchmark indices have eased as well and are testing lower levels currently.
 ______________________________________________________________________
COMMODITIES MARKETS MONITOR
USOIL (WTI) 4-Day Chart Summary
Server Time / Timezone EEST (UTC+02:00)
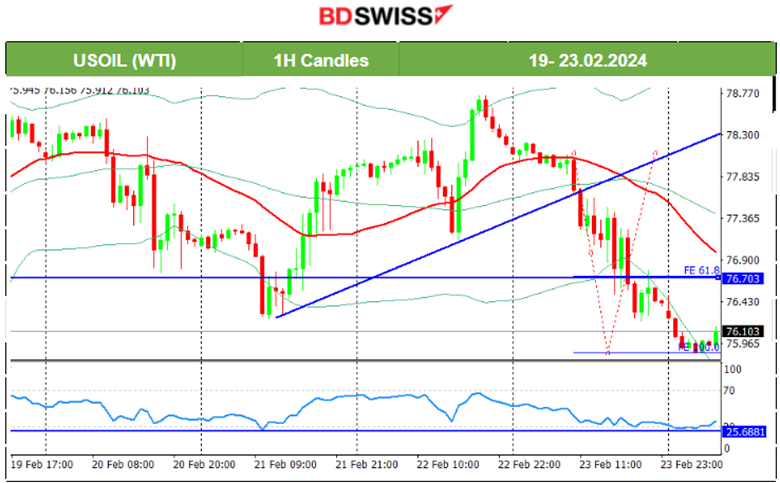
Price Movement
On the 21st the price continued with the drop but stopped when it reached the support near the 76.20 USD/b level. It soon reversed to the upside heavily, crossing the 30-period MA on its way up and reaching above 78 USD/b. The 22nd Feb was quite volatile. The price reached the resistance near 78.7 USD/b before reversing fully to the downside. On the 23rd Feb, the price moved below the MA and dropped heavily, reaching the support near 75.85 USD/b. A retracement is possible as depicted on the chart. The alternative scenario which is less probable, could cause the price to drop to 75.5 USD/b.
TradingView Analysis:
https://www.tradingview.com/chart/USOIL/BC3M2BwO-USOIL-Post-Reversal-26-02-2024/
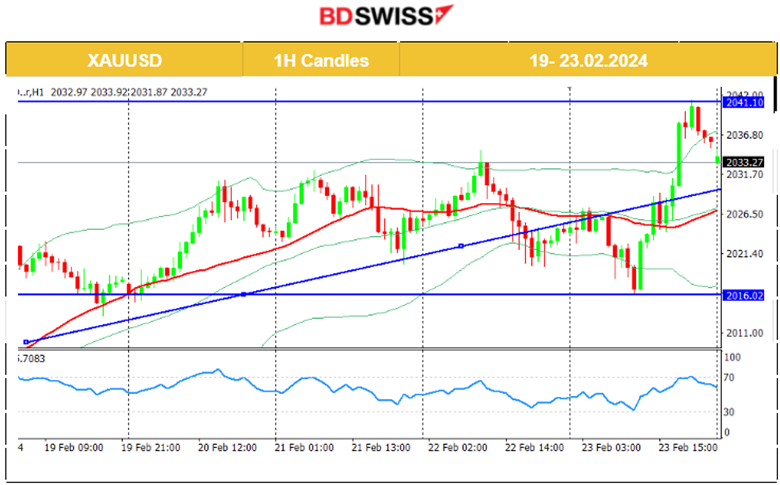
 XAUUSD (Gold) 4-Day Chart Summary
Server Time / Timezone EEST (UTC+02:00)
Price Movement
The divergence eventually led to a drop back to 2020 USD/oz on the 21st Feb as stated in our previous analysis. After the drop, Gold reversed to the upside as the dollar depreciated heavily. On the 22nd, Gold experienced a significant drop, finally settling below the MA signalling finally the end of the uptrend. However, on the 23rd Feb, Gold moved to the downside, finding support at 2016 USD/oz and in a short period of time reversed significantly to the upside crossing the 30-period MA on its way up reaching the resistance at 2041 USD/oz. That signalled a new uptrend perhaps. The market opening found the price at the retracement level of 61.8 Fibo near 2033 USD/oz.
 ______________________________________________________________
News Reports Monitor – Today Trading Day (26 Feb 2024)
Server Time / Timezone EEST (UTC+02:00)
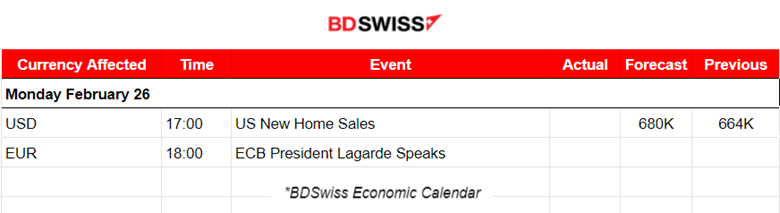
- Midnight – Night Session (Asian)
No important announcements, no special scheduled releases.
- Morning – Day Session (European and N. American Session)
No important announcements, no special scheduled releases.
General Verdict:
______________________________________________________________


