PREVIOUS TRADING DAY EVENTS – 25 April 2023
Announcements:
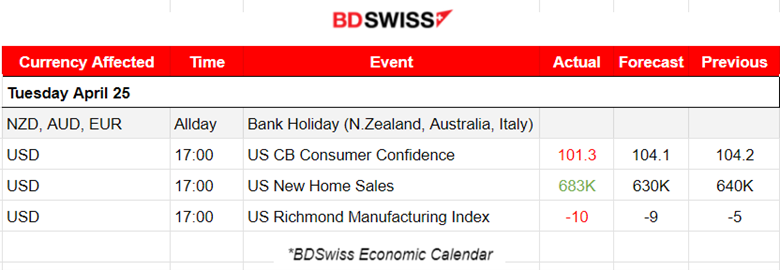
- According to the U.S. Conference Board Consumer Confidence Index® figure, which was released at 101.3, lower than expected and down from 104.0 in March, consumer confidence experienced a decline.
There are now more pessimistic views about the economic outlook, even as current conditions improved.
“Consumers became more pessimistic about the outlook for both business conditions and labor markets,” said Ataman Ozyildirim, senior director of economics at the Conference Board.
“While consumers’ relatively favourable assessment of the current business environment improved somewhat in April, their expectations fell and remain below the level which often signals a recession looming in the short term.”
The six-month job expectations are pessimistic. Only 12.5% expect more jobs to be available in the coming months. They expect that the labour market will show further cooling and even show dangerous unemployment levels if a recession takes place.
Inflation is way above the Federal Reserve’s target. It will be harder to make loans with more hikes and both supply and spending will decline further.
Two of its three component indexes—shipments and new orders—declined. The shipments index dropped from 2 in March to -7 in April, while the new orders index fell from -11 to -20.
______________________________________________________________________
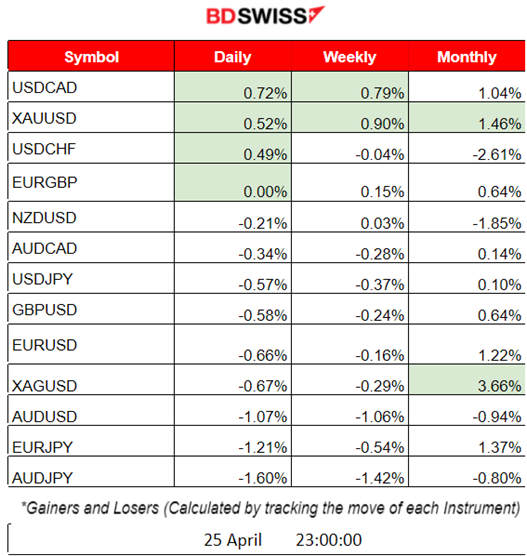
Summary Daily Moves – Winners vs Losers (25 April 2023)
______________________________________________________________________
News Reports Monitor – Previous Trading Day (25 April 2023)
Server Time / Timezone EEST (UTC+03:00)
- Midnight – Night Session (Asian)
No significant news announcements and no important scheduled releases.
- Morning – Day Session (European)
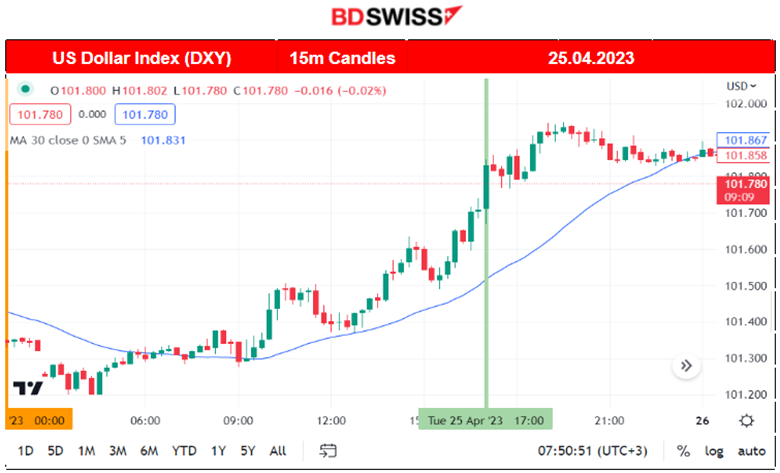
At 17:00, the Conference Board Consumer Confidence Index® figure showed that it fell to 101.3 (1985=100) in April, down from 104.0 in March. It did not have a significant impact or a shock on the USD. Neither the New Home Sales had an interesting effect. The currency was already in appreciation and moving steadily upwards since the European Markets Opening.
General Verdict:
______________________________________________________________________
FOREX MARKETS MONITOR
EURUSD (25.04.2023) Chart Summary
Server Time / Timezone EEST (UTC+03:00)
Price Movement
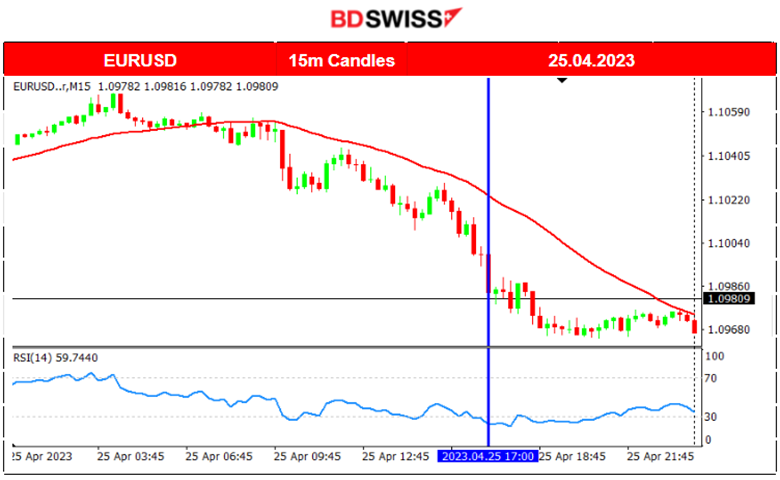
EURUSD was moving downwards since the European Markets opening at 10:00, with a steady pace. It experienced an intraday downward trend while it was moving below the 30-period MA. Since no shocks occurred, no opportunities for retracement occurred either. As per the DXY chart, it is clear that the pair was mainly driven by the USD (mirror).
EURGBP (25.04.2023) Chart Summary
Server Time / Timezone EEST (UTC+03:00)
Price Movement
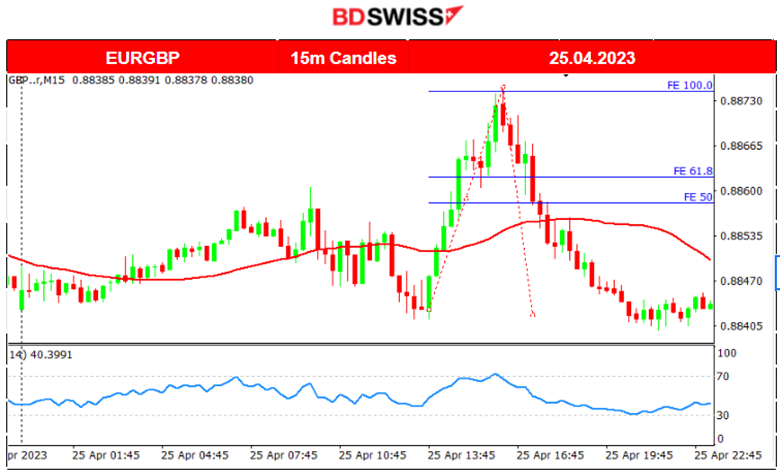
EURGBP was more interesting. The pair started to move unexpectedly upwards after 13:40. The GBP has appreciated greatly causing an intraday rapid move upwards. It found resistance near 0.88745 and then retracted back to the mean.
Trading Opportunities
The clear rapid movement upwards and the resistance that the pair found created room for retracement. Using the Fibonacci Expansion we can identify the 61.8% level that the market eventually retraces to, most of the time. As per the chart, the pair retraced even further, to the 50% level, and also crossed the MA, moving downwards and under the 30-period MA.
____________________________________________________________________
EQUITY MARKETS MONITOR
NAS100 (NDX) 4-Day Chart Summary
Server Time / Timezone EEST (UTC+03:00)
Price Movement
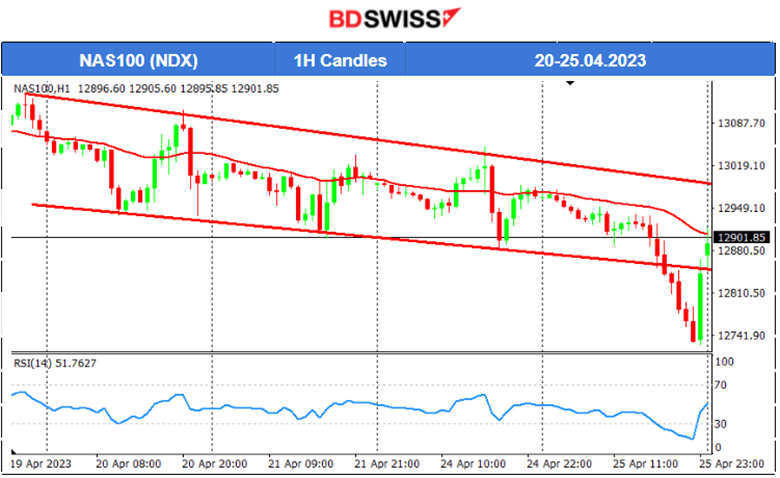
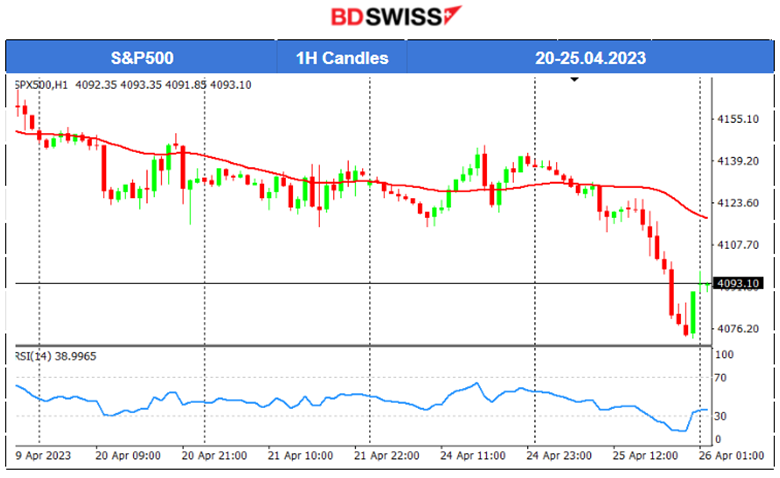
The downward channel in which the index was moving broke yesterday. Stocks were moving with high volatility slightly downwards but it was not clear if the direction was to hold. On the 25th of April, the index broke significant support levels near 12890 USD, dropping rapidly to 12725 USD before it retraced back almost entirely. It does not look good for U.S. Stocks. US30 and S&P500 had similar experiences, but with the indexes remaining lower than NAS100 on the 25th, as retracement did not really take place in their case.
COMMODITIES MARKETS MONITOR
USOIL (WTI) 4-Day Chart Summary
Server Time / Timezone EEST (UTC+03:00)
Price Movement
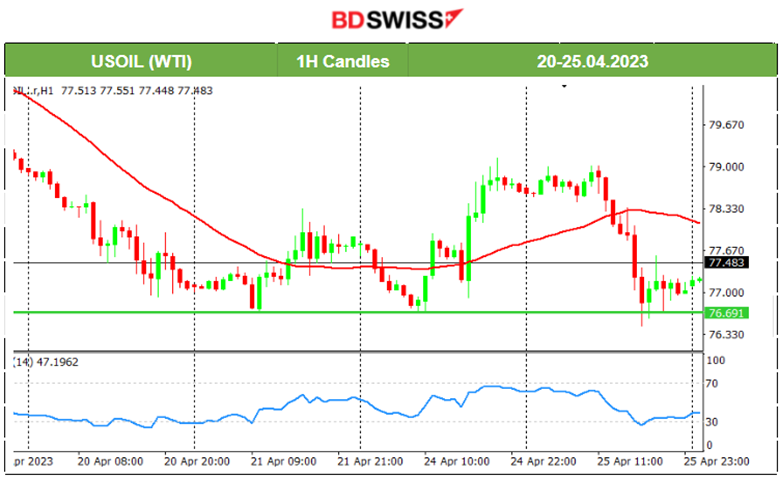
Crude seems to resist going upwards and is still testing the support near 76.7 USD. It had stopped after a long way down when it found support on the 21st of April. After that, it retraced back moving above the 30-period MA signalling a stop for the downward trend. Then, it moved sideways and further upwards to the 79 USD level before diving yesterday back to even near 76.5 USD.
XAUUSD (Gold) 4-Day Chart Summary
Server Time / Timezone EEST (UTC+03:00)
Price Movement
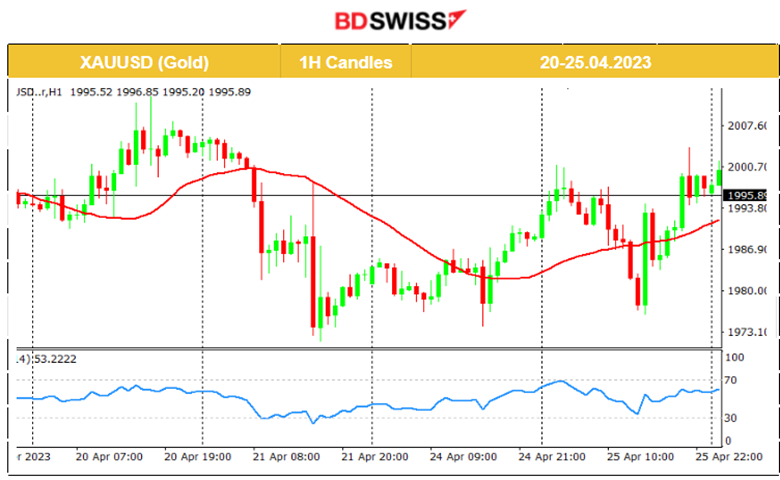
Gold is moving around the 30-period MA, not showing any clear trends or future direction. It recently got back to testing the resistance near the 2000 USD level. Recent deviations from the MA are maximum 10-15 USD.
______________________________________________________________
News Reports Monitor – Today Trading Day (26 April 2023)
Server Time / Timezone EEST (UTC+03:00)
- Midnight – Night Session (Asian)
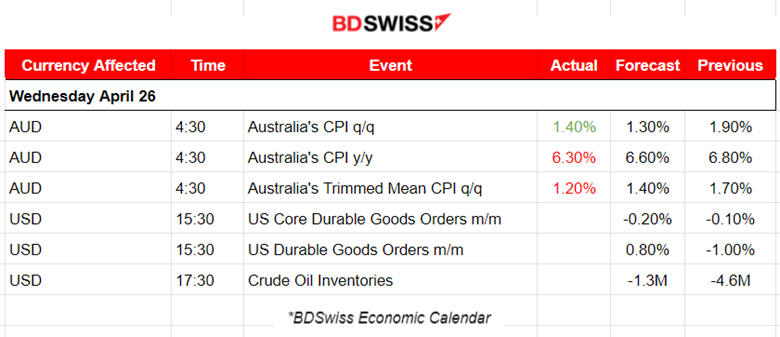
At 4:30, Australia’s CPI figures were released. Since they are inflation-related data, there was an impact on the AUD causing intraday shocks. Major AUD pairs with AUD as base currency dropped more than 20 pips before the full retracement which was quite rapid.
- Morning – Day Session (European)
At 15:30, some volatility is expected with the release of the Durable Goods figures, a leading indicator of production – rising purchase orders signal that manufacturers will increase activity.
At 17:30, the change in Crude Oil inventories will have an interest to many since its price had significantly dropped recently.
General Verdict:
______________________________________________________________


