

PREVIOUS TRADING DAY EVENTS – 21 April 2023
Announcements:
“The upturn in demand has also been accompanied by a rekindling of price pressures,” Chris Williamson, the chief business economist at S&P Global Market Intelligence, said in a statement. “This increase helps explain why core inflation has proven stubbornly elevated at 5.6% and points to a possible upturn – or at least some stickiness – in consumer price inflation.”
The Federal Reserve is expected to raise interest rates again next month despite the economic reports the previous week, showing a slowing U.S. economy. The central bank is still likely to hike by 25 basis points at its May meeting.
“It’s very, very logical for the Fed to look at this situation as one in which they need to re-establish their credibility in fighting inflation, and in order to re-establish their credibility they have to err on the side of being tougher on inflation even at the expense of the economy,” said Jason Pride, chief of investment strategy and research at Glenmede in Philadelphia.
Source:
https://www.reuters.com/markets/global-markets-wrapup-1pix-2023-04-21/
https://www.bnnbloomberg.ca/us-business-activity-unexpectedly-jumps-risking-more-inflation-1.1910636
The U.K. is facing double-digit inflation, interest rates have risen sharply, with further increases expected this year.
“Poor weather impacted sales across almost all sectors,” said Darren Morgan, ONS director of economic statistics. “Food store sales also slipped, with retailer feedback suggesting the increased cost of living and climbing food prices are continuing to affect consumer spending.”
“Even though the worst of the declines in retail sales are in the past, higher interest rates will restrain spending this year,” said Paul Dales, chief U.K. economist at Capital Economics. “March probably isn’t as bad as it looks as it was partly due to the unusually wet weather. The further rise in consumer confidence in April paints a much sunnier picture.”
______________________________________________________________________
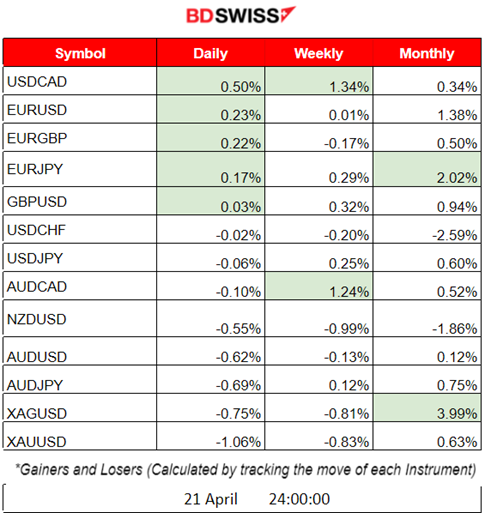
Summary Daily Moves – Winners vs Losers (21 April 2023)
______________________________________________________________________
News Reports Monitor – Previous Trading Day (21 April 2023)
Server Time / Timezone EEST (UTC+03:00)
- Midnight – Night Session (Asian)
No significant news announcements and no important scheduled releases.
- Morning – Day Session (European)
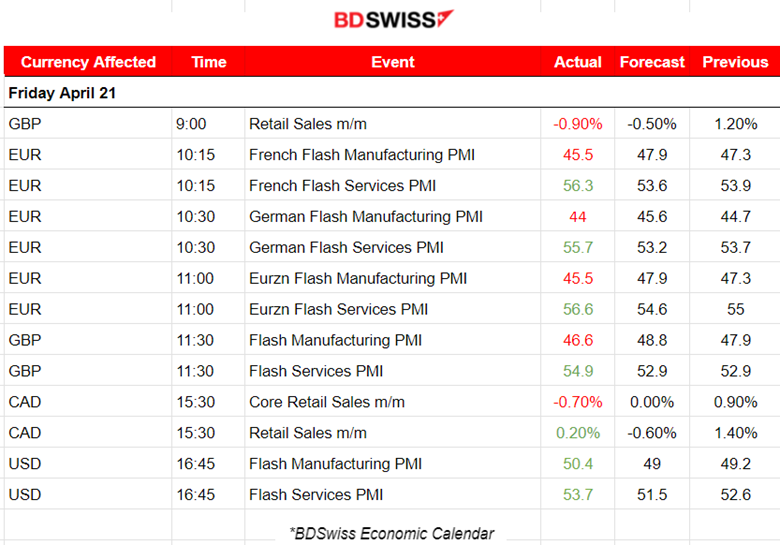
At 9:00, the Retails Sales figure for the U.K. was released. U.K. retail sales were a tad worse than expected in March, falling by 1%. No significant impact on the markets.
The trading day was dedicated to the PMI releases for both the services and the manufacturing sectors, for all major economies and regions (i.e. Eurozone, U.K., France, Germany and U.S. PMIs).
Manufacturing Sector:
The United Kingdom, France, German and Eurozone PMIs showed lower figures than expected and importantly below their previous figures, showing contraction. They were below 50. Actually, there were divergent trends by sector as strong growth in the service economy contrasted with another fall in manufacturing production. That situation took place in all these regions except the U.S. The manufacturing PMI for the U.S. actually showed a higher-than-expected and higher than the previous figure. It was also a little above 50.
Services Sector:
For all the above regions, we see that the services PMIs show higher figures than expected and more than the previous ones. All were over level 50. The HCOB Flash PMI data highlight the strongest expansion of the French economy since May 2022. Due to thriving business in the service sector, the German economy grew as strongly in April as it had last twelve years. The Eurozone recorded the strongest economic growth in eleven months. U.K. private sector firms signalled an increase in business activity for the third consecutive month in April. April data also indicated a faster rise in business activity for U.S. firms, according to the latest PMI data.
At 15:30, Canada’s Retails Sales did not have a significant impact on the markets. Retail sales decreased by 0.2% to $66.3 billion in February. Core retail sales showed that, in volume terms, retail sales decreased by 0.7% in February.
General Verdict:
______________________________________________________________________
FOREX MARKETS MONITOR
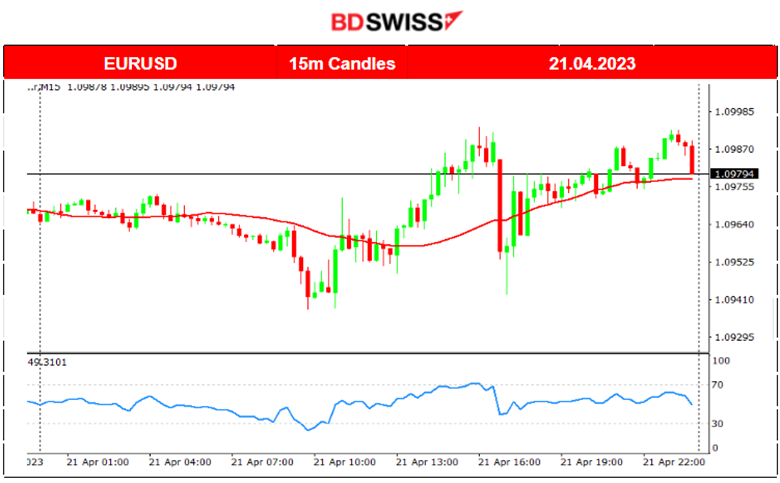
EURUSD (21.04.2023) Chart Summary
Server Time / Timezone EEST (UTC+03:00)
Price Movement
After the European Markets opening and the release of the Eurozone’s PMI data, the EURUSD moved further upwards. It found resistance and eventually reversed with the release of the U.S. PMI data, causing the pair to fall. The moves were not so high to cause significant opportunities for trading.
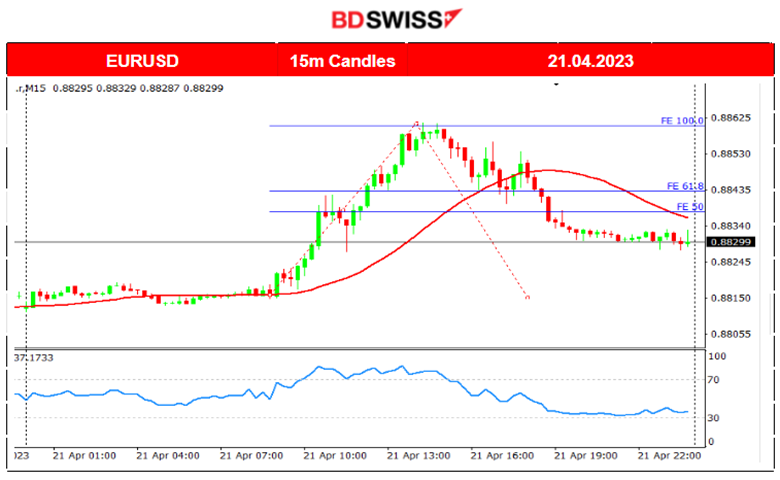
EURGBP (21.04.2023) Chart Summary
Server Time / Timezone EEST (UTC+03:00)
Price Movement
The pair started rising as soon as the U.K. Retail Sales figures came out. The GBP depreciated while the PMIs for EUR caused the EURGBP to move further upwards. It found resistance at the 0.88600 level and soon retraced back to the mean. It eventually crossed the 30-period MA and moved further downwards towards the end of the trading day.
Trading Opportunity
After 9:00, the pair experienced a rapid movement upwards, like a shock. When it ended and the pair found resistance, we used the Fibonacci Expansion tool to identify the Fibo level 61.8 to the price that it potentially will retrace.
Relevant analysis on TradingView:
https://www.tradingview.com/chart/EURGBP/yZ3aosOI-EURGBP-Retracement-opp-21-04-2023/
____________________________________________________________________
EQUITY MARKETS MONITOR
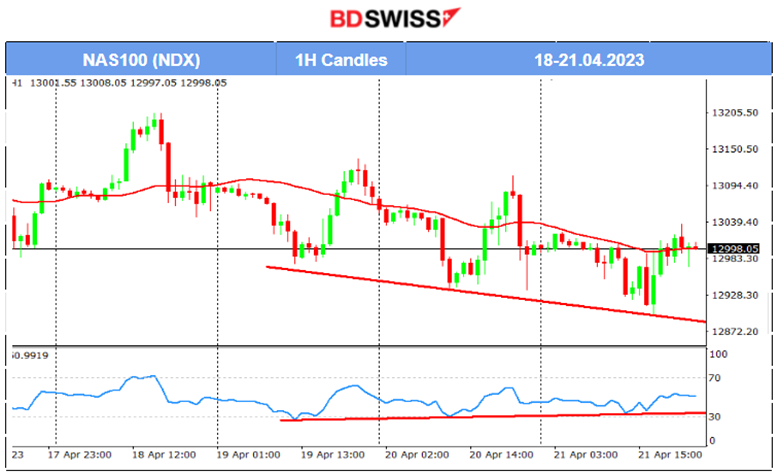
NAS100 (NDX) 4-Day Chart Summary
Server Time / Timezone EEST (UTC+03:00)
Price Movement
U.S. stocks continue their sideways movement. All main three U.S. indices are moving around the 30-period MA with no signs of trends forming, at least downwards. In fact, the RSI shows higher highs while the price shows lower lows. This might confirm that the index is experiencing significant resistance. According to the latest U.S. PMI data, business activity unexpectedly climbed this month to nearly a one-year high, bolstered by stronger services and manufacturing. Firms saw new orders jump to the highest rate in 11 months, especially in the service sector.
______________________________________________________________________
COMMODITIES MARKETS MONITOR
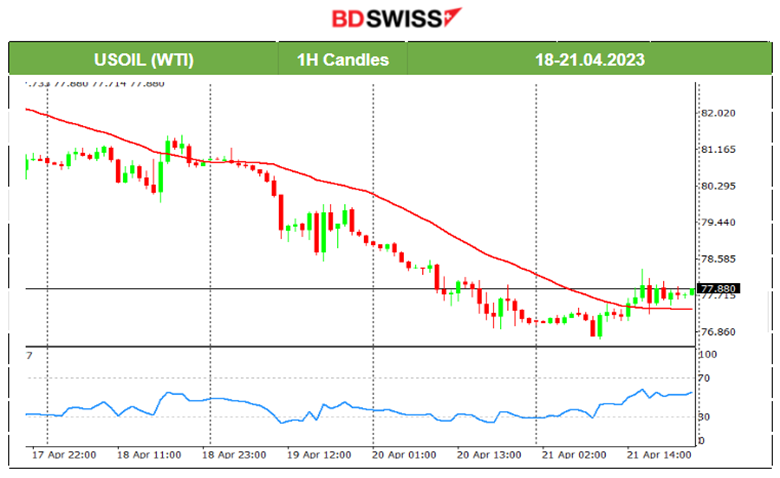
USOIL (WTI) 4-Day Chart Summary
Server Time / Timezone EEST (UTC+03:00)
Price Movement
Finally, after a week of downward movement below the 30-period MA, Crude has finally shown signs that the trend might have stopped. On Friday, its price showed significant resistance to the downside, moving eventually upwards, crossing the MA and moving above it. This does not mean that the price will move upwards, however, it only indicates that the trend will probably not continue. Since the downward movement was relatively rapid, we might see a retracement actually happening next week, with the 79 USD level acting as the next target support level.
Potential move analysis on TradingView:
https://www.tradingview.com/chart/USOIL.F/Hu8MmJmr-USOIL-Reverses-21-04-2023/
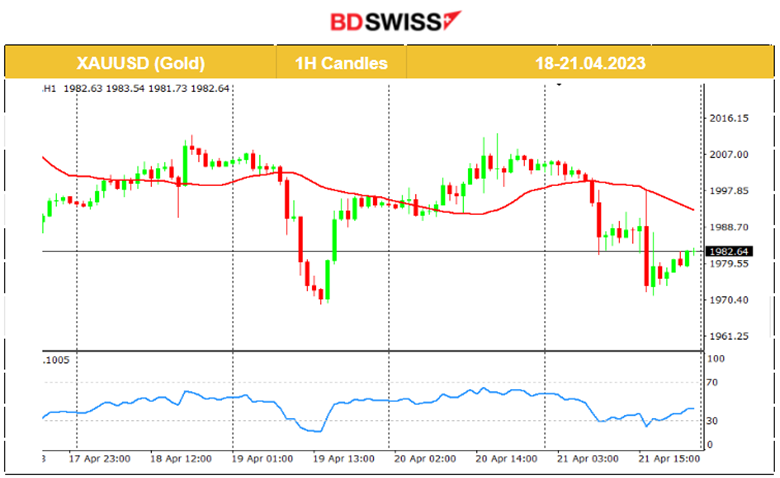
XAUUSD (Gold) 4-Day Chart Summary
Server Time / Timezone EEST (UTC+03:00)
Price Movement
Gold is moving sideways in a unique volatile way. Despite the frequent various shocks with USD appreciation, its price retraces back to the 30-period MA which trades close to the 2000 USD level. On Friday, it actually moved lower and closed the day at 1982 USD as the USD appreciated heavily due to the PMI figure releases that showed U.S. Economy expansion in business activity.
______________________________________________________________
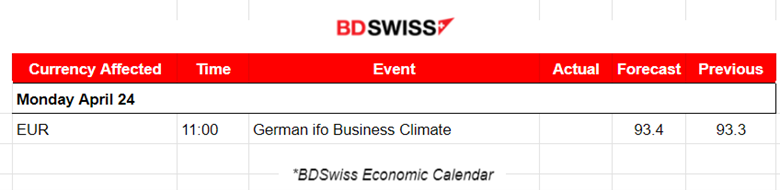
News Reports Monitor – Today Trading Day (24 April 2023)
Server Time / Timezone EEST (UTC+03:00)
- Midnight – Night Session (Asian)
No significant news announcements and no important scheduled releases.
- Morning – Day Session (European)
This Monday, there are no scheduled releases that we expect will have a great impact on the markets.
General Verdict:
______________________________________________________________


