Previous Trading Day’s Events (08.08.2024)
“There is still evidence from today’s data that labour market conditions are loosening, but only very gradually and not in a way that demands an imminent reduction in interest rates,” said Andrew Grantham, a senior economist with CIBC Capital Markets, adding he expects the first rate cut in June.
The Bank of Canada on Wednesday said it was too early to consider lowering borrowing rates. It has kept its key overnight rate unchanged at 5% at the past five policy-setting meetings.
“Wage growth, which had been running at 4 or 5% … there’s certainly some early signs that it’s beginning to ease,” Governor Tiff Macklem told a news conference on Wednesday, adding that it was still not enough to warrant an early rate cut.
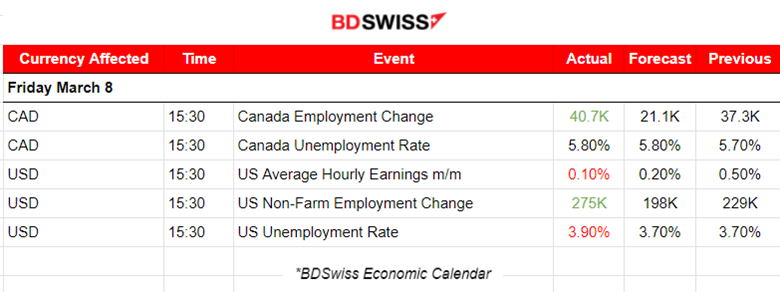
Nonfarm payrolls increased by 275K jobs last month beating expectations. Data for January was revised down to show 229,000 jobs created instead of 353,000 as previously reported.
“The immediate takeaway is the focus on the unemployment rate going from 3.7% to 3.9%. A higher unemployment rate implies that the economy is slowing, which would, in the markets’ view hopefully, necessitate a rate cut sooner rather than later. The figures revised downwards along with the unemployment rate is probably fueling a little bit of a rebound in the futures.” Robert Pavlik, Senior Portfolio Manager, Dakota Wealth, Fairfield, Connecticut.
“The key here is the wage growth than anything else, which came in very modest and well below expectations. This feeds more into the inflation narrative than the strong jobs data. However, the job market data still shows a relatively strong labour force.” Paul Nolte, Senior Wealth Adviser, Murphy & Sylvest, Chicago.
I don’t think the data really means much to the Fed. They’re much more focused on the inflation data and the fact that wage growth was modest is helpful, but that’s the only part of the jobs data that I think the Fed is looking at.” Peter Cardillo, Chief Market Economist, Spartan Capital Securities, New York.
______________________________________________________________________
Winners vs Losers
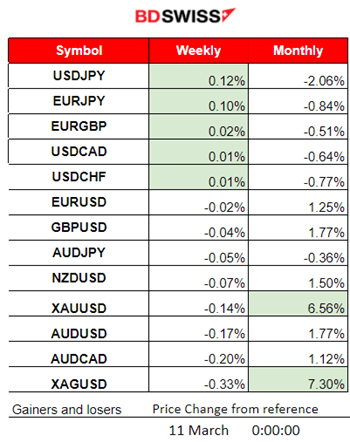
The week just started with pairs showing moderate volatility. The U.S. dollar this month fell near 1.4 points so far causing the FX pairs (with USD as quote currency) to reach high levels. Metals as well saw a huge increase as high demand took place in the same period causing Silver to gain 7.30% and Gold to gain 6.56%.
 ______________________________________________________________________
News Reports Monitor – Previous Trading Day (08 Mar 2024)
Server Time / Timezone EEST (UTC+02:00)
- Midnight – Night Session (Asian)
No important announcements, no special scheduled releases.
- Morning–Day Session (European and N. American Session)
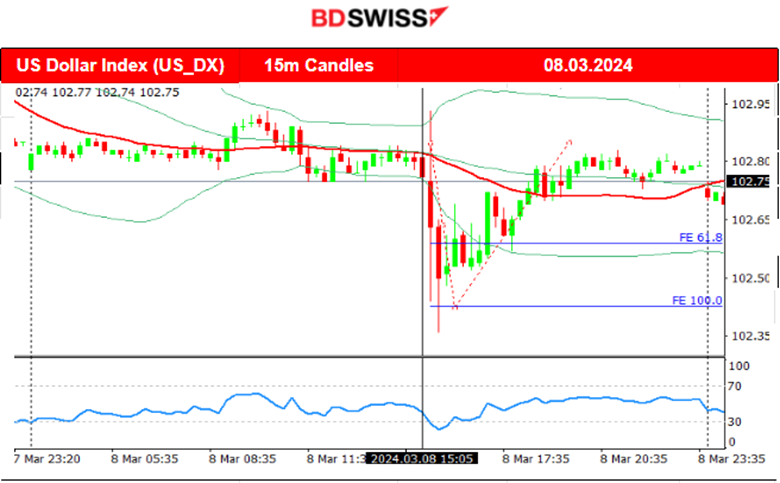
At 15:30 an intraday shock took place affecting several asset classes and major pairs such as the USD and the CAD. Canada showed a surprising growth in employment, beating expectations, causing CAD appreciation at first. The effect reversed soon though. CADCHF jumped 16 pips at that time but reversed fully soon after the release. In the U.S. the NF employment change also beat expectations and showed significant growth. The USD also appreciated at first but quickly depreciated heavily when the volatile market conditions during that time eased, soon after the release. However, the effect faded with the U.S. dollar index reversing back to the MA. Despite the favourable employment figures for the two currencies, unemployment rate figures were actually reported higher and their weakening prevailed. The effect on CAD lasted longer and USDCAD moved to the upside eventually.
General Verdict:
 __________________________________________________________________
FOREX MARKETS MONITOR
EURUSD (08.03.2024) 15m Chart Summary
Server Time / Timezone EEST (UTC+02:00)
Price Movement
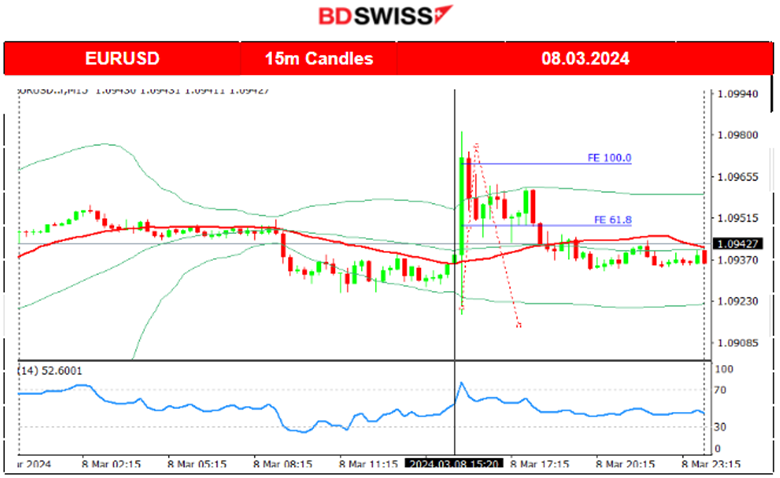
The EURUSD is obviously mirroring the dollar index path. The activity was quite low before the NFP news with the pair lowering below the intraday 30-period MA before eventually jumping near 40 pips during the news as the USD suffered strong depreciation. The pair soon reversed after USD strengthened quite quickly again, coming back to the MA, settling around it and close to it until the end of the trading day.
 ___________________________________________________________________
CRYPTO MARKETS MONITOR
BTCUSD (Bitcoin) Chart Summary
Server Time / Timezone EEST (UTC+02:00)
Price Movement
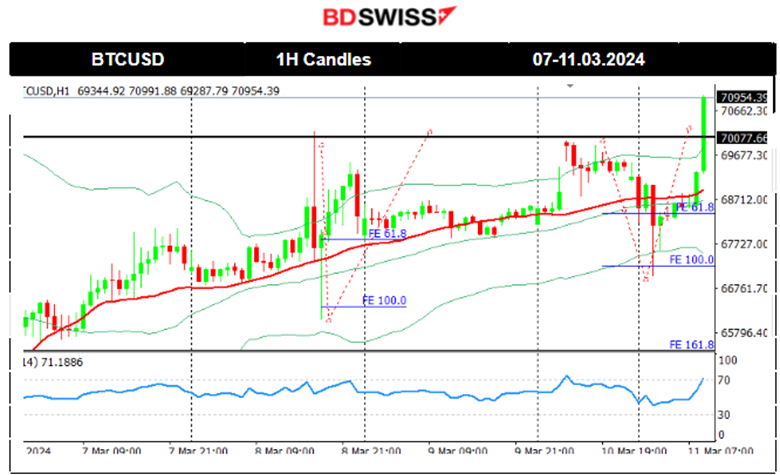
Bitcoin continues with the uptrend. Just passed the 70K resistance aggressively and jumped further breaking all-time highs without any indication of a significant resistance at the moment. Technically it could rapidly increase by 4K before any notable retracement takes place.
 Crypto sorted by Highest Market Cap:
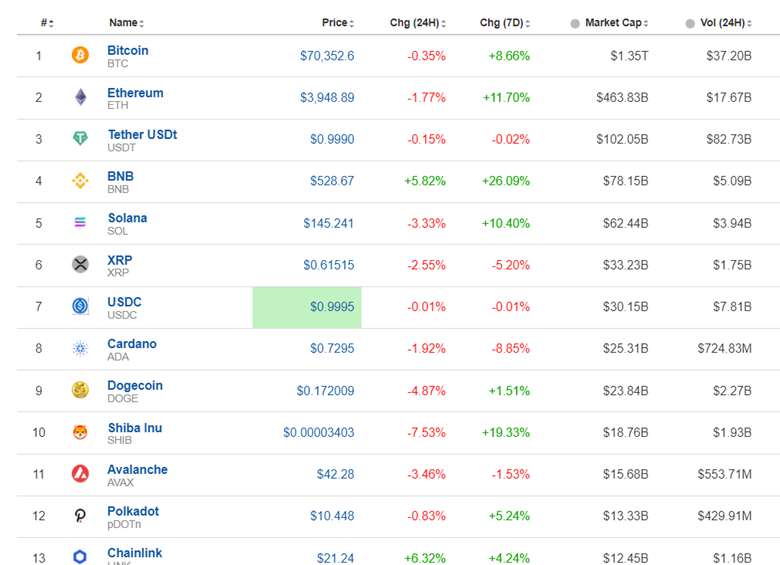
After the NFP report a retreat of gains was observed in the Crypto assets. However, today we see an aggressive rebound.
Source: https://www.investing.com/crypto/currencies
______________________________________________________________________
EQUITY MARKETS MONITOR
NAS100 (NDX) 4-Day Chart Summary
Server Time / Timezone EEST (UTC+02:00)
Price Movement
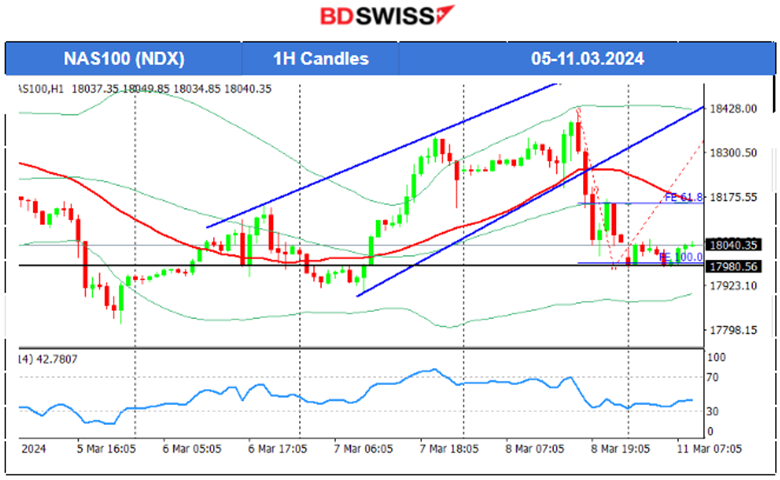
On the 7th of March, the market moved to the upside as future borrowing costs could lower significantly and as Powell reassures that cuts will take place as long as the economy continues to show resilience and progress in regards to inflation. The dollar weakened significantly while stocks gained. The index jumped out of the triangle formation reaching the resistance near 18,350 USD before retracing to the 61.8 Fibo. As predicted in our previous analysis, the index moved higher before the NFP report release and soon later after the exchange opening it fell rapidly and heavily to the support near 17,980 USD. Retracement is possible to follow, back to the 30-period MA and 61.8 Fibo level if support is kept strong.
 ______________________________________________________________________
COMMODITIES MARKETS MONITOR
USOIL (WTI) 4-Day Chart Summary
Server Time / Timezone EEST (UTC+02:00)
Price Movement
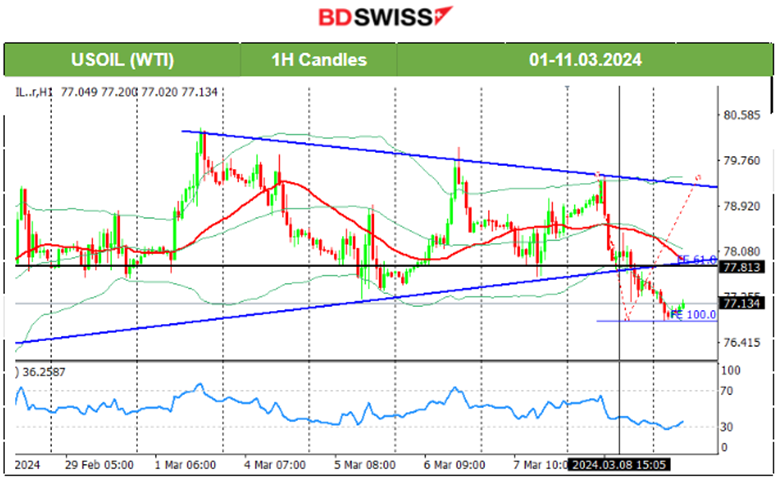
On the 6th of March, a surprise increase in the price took place causing a breakout of the depicted channel with the price reaching the resistance at near 80 USD/b before retracing and back to the 30-period MA. On the 7th of March, the price was on a quite volatile path but closed the trading day higher. Crude oil fell rapidly from the 8th March peak of 79.5 to 76.85 USD/b. Considering that deviations from means are roughly 10 USD currently the retracement about that amount to the 61.8 Fibo level is quite probable. Now, the fundamentals: Demand from China looks to be lagging causing the dive, however, supplies have remained on the tighter side given OPEC’s production cuts and Russian sanctions slowing exports causing price resilience excluding the probabilities of sharp drops, keeping price in balance. Technically, the price broke a triangle formation that could cause the price to reach the next support at 76 USD/b. However, without retracements to the MA, it would be quite surprising.
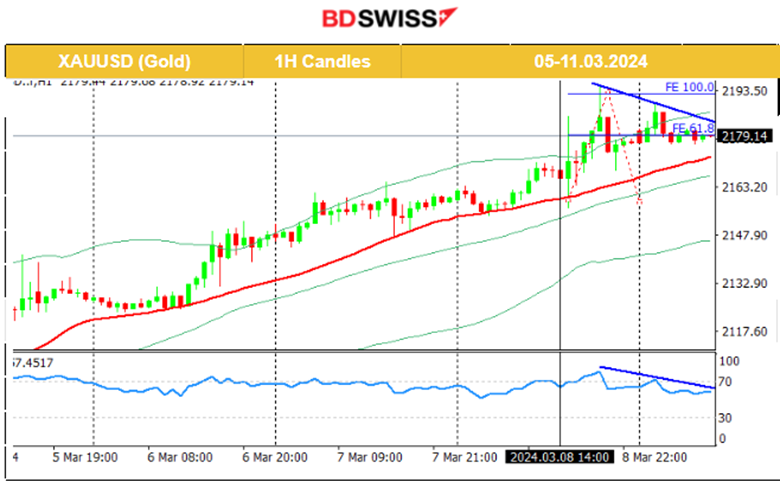
 XAUUSD (Gold) 4-Day Chart Summary
Server Time / Timezone EEST (UTC+02:00)
Price Movement
On the 6th of March, support remained strong and the dollar depreciation pushed Gold to higher and higher levels reaching over 2,150 USD/oz. On the 7th of March, the RSI continued with lower highs but the USD weakening kept Gold stable and leaning more to the upside instead. On the 8th of March, Gold climbed further aggressively upon the NFP release and after it found resistance it retraced to the 61.8 Fibo Level. Currently, it is quite uncertain if the price will see a strong reversal.
 ______________________________________________________________
News Reports Monitor – Today Trading Day (11 Mar 2024)
Server Time / Timezone EEST (UTC+02:00)

- Midnight – Night Session (Asian)
No important announcements, no special scheduled releases.
- Morning–Day Session (European and N. American Session)
Japan’s Final GDP report shows that it managed to avert technical recession as revised fourth-quarter data shows that the economy grew 0.4%.
General Verdict:
______________________________________________________________


