PREVIOUS TRADING DAY EVENTS – 18 Oct 2023
Petrol prices kept rising between August and September and this was the main factor pausing a fall in the annual rate.
“Progress in bringing inflation down is proving slow,” said Ian Stewart, chief economist at accountancy firm Deloitte. “The persistence of underlying inflation, and service price pressures, suggests that interest rates are likely to stay close to current levels for much of the next year.”
“We expect the MPC to remain on hold this year, but to continue to push back against any rapid cuts,” Morgan Stanley economist Bruna Skarica said, adding that she expected rate cuts to begin in May 2024 or slightly later.
Consumer prices in Britain have risen 17% in the past two years, an increase that would normally take almost a decade. Wednesday’s data showed core inflation fell less than expected to 6.1% in September from August’s 6.2%. Services price inflation increased to 6.9% in September from 6.8%.
The Dutch bank ING forecasts British inflation would drop to 5% or lower in October and hold near that level for the rest of the year, assuming no significant further rise in oil prices.
Source: https://www.reuters.com/world/uk/uk-inflation-rate-holds-67-september-2023-10-18
______________________________________________________________________
Winners and Losers
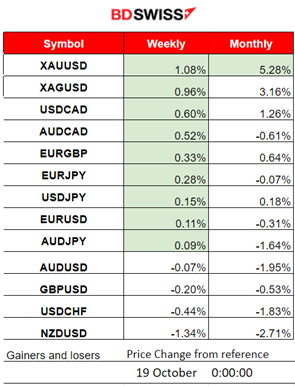
News Reports Monitor – Previous Trading Day (18 Oct 2023)
Server Time / Timezone EEST (UTC+03:00)
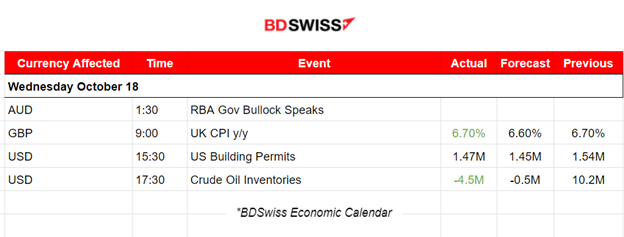
- Midnight – Night Session (Asian)
No important news announcements, no special scheduled figure releases.
- Morning–Day Session (European and N. American Session)
The Consumer Prices Index (CPI) for the U.K. rose by 6.7% in the 12 months to September 2023, the same rate as in August. This better-than-expected figure caused GBP to appreciate significantly at the time of the release.
At 15:30 the Building Permits were reported lower than expected. The figures were 4.4 % below the revised August rate of 1.54M and 7.2% below the September 2022 rate of 1.58M. The impact on the market was not so great, no major shock was recorded.
Crude inventory data showed a negative change as expected but huge with 4.5M barrels. A bigger-than-expected U.S. storage draw and concerns about global supplies push oil higher, while the Gaza hospital attack and strong Chinese data could be the reasons for oil to climb further these days too.
General Verdict:
The U.S. stock market crashed intraday. All indices broke significant support levels and moved higher after the NYSE opening.
 ____________________________________________________________________
FOREX MARKETS MONITOR
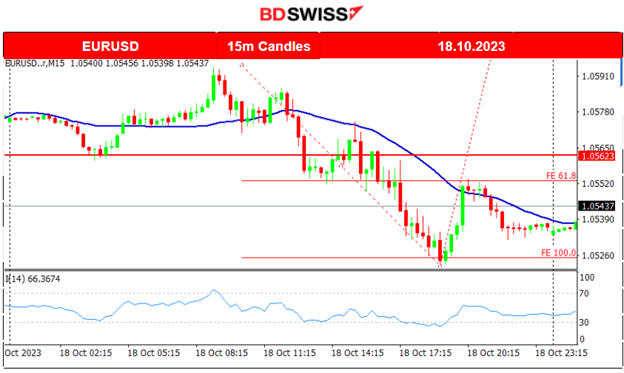
EURUSD (18.10.2023) Chart Summary
Server Time / Timezone EEST (UTC+03:00)
Price Movement
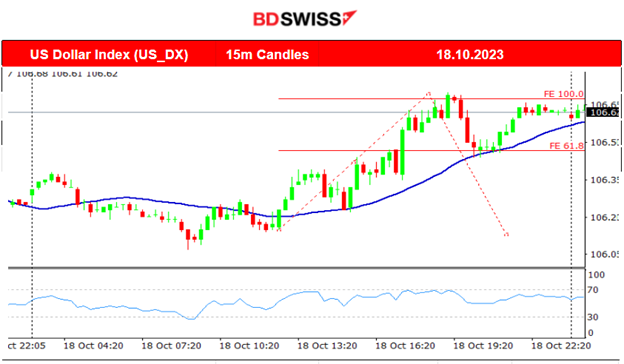
The EURUSD moved significantly after the European sessions started. It dropped steadily breaking the early intraday range reaching the support at 1.05220 before eventually retracing to the 30-period MA. it is mirroring the Dollar Index chart above clearly signalling that the USD is the main driver. The pair closed lower overall as the USD gained strength. No major shocks were recorded and there were no major scheduled figures releases affecting specific pairs except the GBP.
GBPUSD (18.10.2023) Chart Summary
Server Time / Timezone EEST (UTC+03:00)
Price Movement
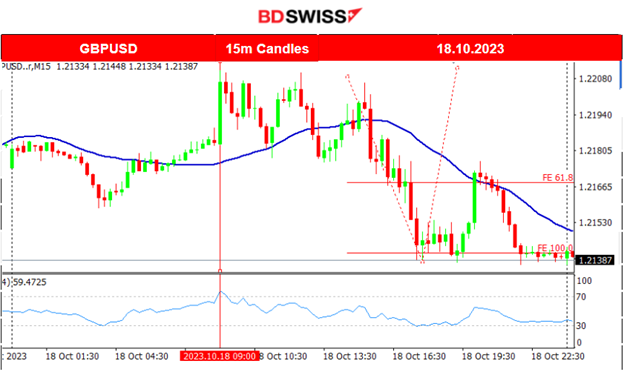
The GBPUSD was affected early at 9:00 with the release of the U.K.’s yearly CPI figure which was reported higher than expected. The pair jumped as GBP appreciated at that time. It reached a significant resistance level and after several tests, it was not broken. The pair reversed to the downside rapidly as the USD appreciated.
This raises concerns in regard to decisions taken by the Central Bank. In September, the BOE decided to keep the OBR at 5.25%, putting a halt on rate hikes for now. However inflationary pressures continue and considering the recent developments concerning oil prices, future policy changes are expected since they are deemed necessary to reach targets.
 ___________________________________________________________________
CRYPTO MARKETS MONITOR
BTCUSD (Bitcoin) 4-Day Chart Summary
Server Time / Timezone EEST (UTC+03:00)
Price Movement
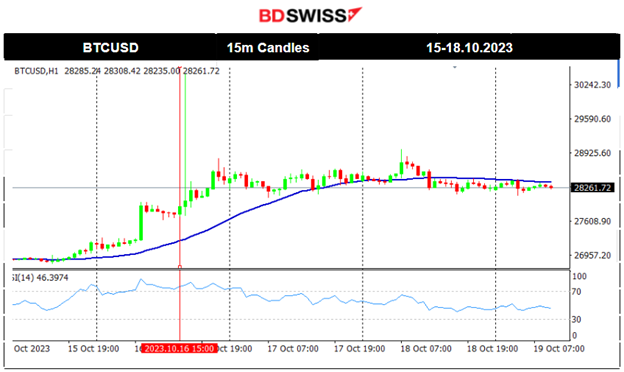
Surprisingly there was movement on the 15th and yesterday morning with bitcoin jumping and breaking the resistance at 27000 and later at 27300 moving significantly upwards over 700 USD. A retracement back at 27650 eventually happened during the day but later a storm took place. Bitcoin surged over 30K USD as a false report took place of a spot ETF approval that was posted on social app X, formerly Twitter, leading to nearly $100 million in liquidations. The post was deleted soon after it was publicly available but had already sparked enough interactions to have that major impact on prices. Bitcoin has since fallen from 30K USD to 28K USD following scepticism from analysts and reporters. We saw that it remained in range; currently near resistance 28900 and support 28100. However, the next very important and apparent resistance is at 29000.
Source: https://finance.yahoo.com/news/bitcoin-jumps-30k-then-dumps-135714532.html
Crypto sorted by Highest Market Cap:
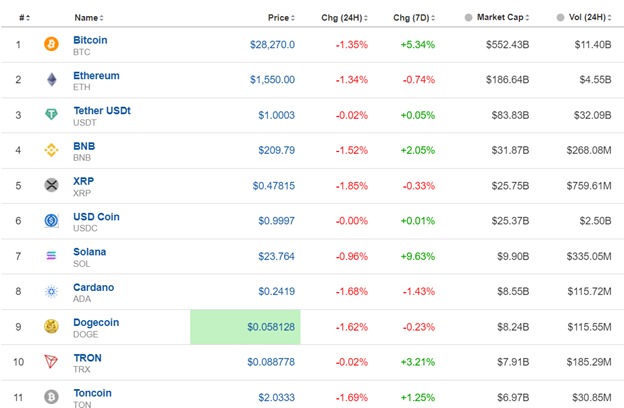
In the last 24 hours, Cryptos suffered losses. Bitcoin, Tron and Solana remain leaders for the 7-day period with positive and high gains.
Source: https://www.investing.com/crypto/currencies
______________________________________________________________________
EQUITY MARKETS MONITOR
NAS100 (NDX) 4-Day Chart Summary
Server Time / Timezone EEST (UTC+03:00)
Price Movement
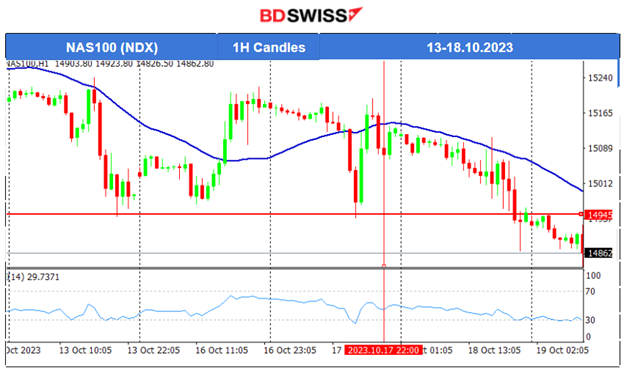
The index was showing signs of a trend reversal or a sideways but volatile path this week. The most possible path was to the downside as technicals were suggesting. On the 17th Oct, the index eventually dropped heavily until the support at 14940 USD before a remarkable full retracement that took place soon after. It showed amazing volatility with big deviations from the mean. Eventually, we see that the downside prevails as the stock market is currently suffering losses. All benchmark indices follow the same path to the downside. NAS100 crashed when it broke significant support levels yesterday such as the 14945 USD and moved lower even to 14825.
 _____________________________________________________________________
COMMODITIES MARKETS MONITOR
USOIL (WTI) 4-Day Chart Summary
Server Time / Timezone EEST (UTC+03:00)
Price Movement
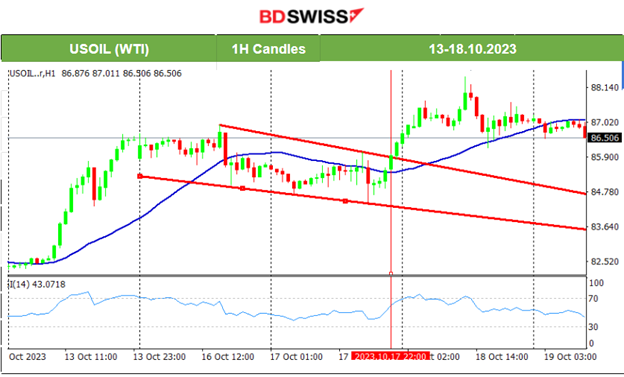
Crude’s price reached a high peak this week at 87 USD/b. After a period of retracement back at 84.5 USD/b it finally moved higher breaking the channel that was formed. On the 17th Oct, it crossed the 30-period MA on its way up and moved higher, reaching the next peak for the week at nearly 88.5 USD before retracing again to the mean.
XAUUSD (Gold) 4-Day Chart Summary
Server Time / Timezone EEST (UTC+03:00)
Price Movement
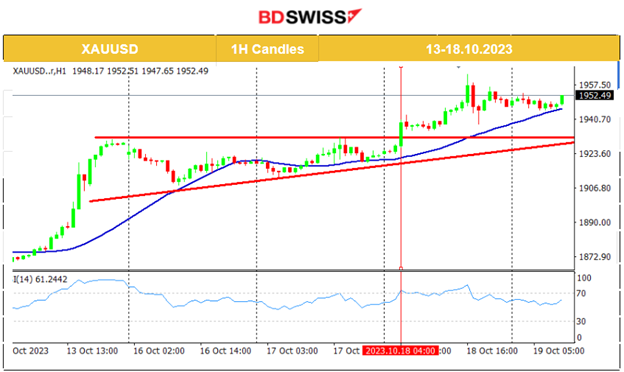
Gold was on an uptrend last week but on the 13th it experienced a rapid movement to the upside near 60 USD. The 1885 level was broken and its price was boosted to the upside before retracing. It later tested significant resistance levels, broke them and after breaking consolidation, it moved even higher reaching 1940 USD/oz. A triangle formation was recorded this week and on the 18th of Oct, the price jumped breaking that triangle and moving to the upside rapidly reaching the next resistance at near 1960 USD/oz. It currently remains in consolidation and in the range of a smaller triangle formation. The trend is clearly on the upside.
 ______________________________________________________________
News Reports Monitor – Today Trading Day (19 Oct 2023)
Server Time / Timezone EEST (UTC+03:00)
- Midnight – Night Session (Asian)
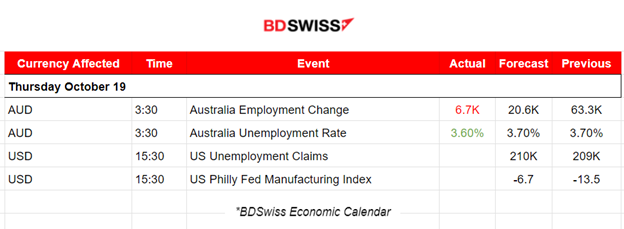
At 3:30 the labour market data for Australia came out. Just a 6.7K change in employment while the unemployment rate was reported lower than expected. Fewer Australians have been looking for work during this period. The AUD was affected with depreciation upon release but the impact was minimal. AUDUSD dropped little more than 20 pips and continued later to the downside until it found support reaching near 35 pips drop overall from the time of the news release.
- Morning–Day Session (European and N. American Session)
Important labour market data for the U.S. to be reported at 15:30 Unemployment claims remain recently close to the 200K level. Recent other reports show that the labour market is remarkably resilient and still tight. The Fed decided to halt interest rates in September keeping the Fed Funds Rate at 5.5% in anticipation that the policy of keeping rates high would bring the desired result. However, as the recent CPI data reports suggest this is not happening. We might expect a moderate shock at 15:30 if a surprise with a less-than-expected figure release showing lower claims occurs.
General Verdict:
______________________________________________________________


