

Previous Trading Day’s Events (14.05.2024)
The BoE said that the labour market remained tight by historical standards but the central bank could consider cutting rates over the summer. Last week, it signalled that it could start cutting rates from its current 16-year high of 5.25% as early as its meeting next month.
Source: https://www.reuters.com/world/uk/uk-regular-pay-grows-by-stronger-than-expected-60-2024-05-14
“Inflation at the producer level is back on the front burner this month and consumers are sure to feel the heat as higher production costs will feed into the inflation they see in the goods and services they buy,” said Christopher Rupkey, chief economist at FWDBONDS. “If Fed officials were seeking some moderation from the inflation outbreak in the first quarter, it is not showing up at the start of the second quarter.”
The producer price index for final demand rose 0.5% last month after falling by a downwardly revised 0.1% in March. A 0.6% jump in services accounted for nearly three-quarters of the increase in the PPI. Inflation surged in the first quarter amid strong domestic demand after slowing for much of last year. Economists are optimistic that inflation will resume its downward trend this quarter as the labour market is cooling.
Some economists believe the Fed could deliver the first rate cut in July. The U.S. central bank early this month left its benchmark overnight interest rate unchanged in the current 5.25%-5.50% range, where it has been since July. The Fed has raised its policy rate by 525 basis points since March 2022.
Consumer price data today could offer fresh clues on the timing of the much-awaited rate cut.
Source: https://www.reuters.com/markets/us/us-producer-prices-increase-more-than-expected-april-2024-05-14/
______________________________________________________________________
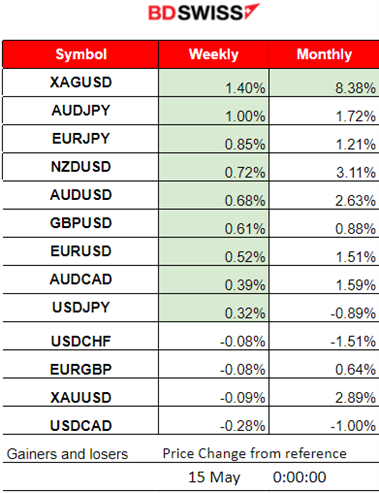
Winners vs Losers
Silver is on the top of the winner’s list still with 1.40% gains so far and 8.38% for the month. JPY pairs follow because the JPY is showing notable weakness. Metals are reversing to the upside, correcting after last week’s drop.
 ______________________________________________________________________
News Reports Monitor – Previous Trading Day (14.05.2024)
Server Time / Timezone EEST (UTC+03:00)
- Midnight – Night Session (Asian)
No important news announcements, no special scheduled releases.
- Morning – Day Session (European and N. American Session)
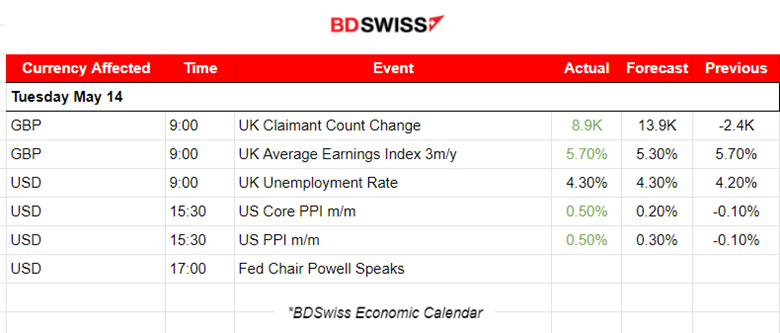
At 9:00 the U.K. Claimant Count (number of people claiming unemployment-related benefits) change was reported at just 8.9K, lower than the expected 13.9K. Average earnings growth remained steady at 5.7% and the monthly unemployment rate increased to 4.30% as expected. Payrolled employees in the U.K. fell by 5K (0.0%) between February and March 2024. The data suggest cooling which is what the BOE wants to see and be more confident that the next inflation figure release has the potential to fall further towards the target. The market reacted with a low-level intraday shock and no one-sided direction for GBP pairs.
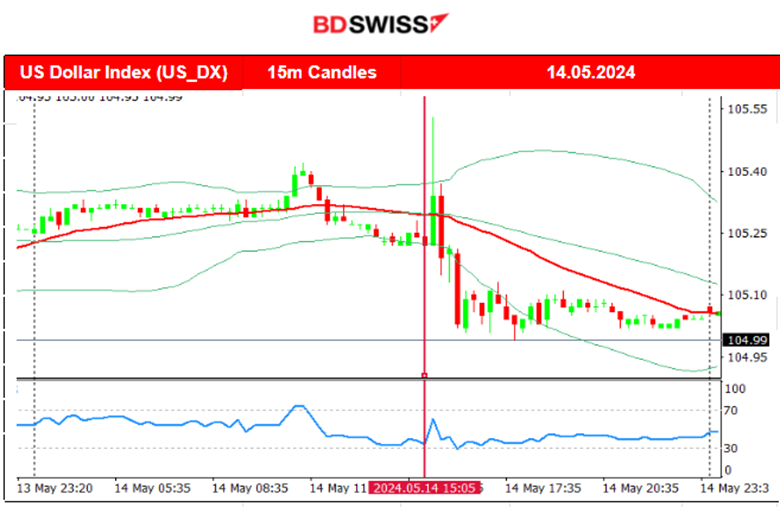
U.S. PPI figures were released the same day at 15:30 and shook the market. A surprise to the upside caused the market participants to react with an initial dollar appreciation followed by an immediate depreciation that brought the dollar index below the intraday mean and stayed lower. This response to the news hints at a great amount of uncertainty. People were not waiting for such a miss in expectations and the fact is that the dollar is weakening. After the recent weakened labour market (low NFP/ high unemployment claims), traders expected inflation to cool instead of a steady or even accelerating pace that was observed recently.
General Verdict:
 __________________________________________________________________
FOREX MARKETS MONITOR
EURUSD (14.05.2024) 15m Chart Summary
Server Time / Timezone EEST (UTC+03:00)
Price Movement
The pair started with low volatility to move sideways around the 30-period MA and experienced more volatility later after the start of the European session. It crossed the MA and moved to the upside before the PPI news. At the time of the news release the USD appreciated heavily but only momentarily causing the EURUSD to drop near 40 pips before reversing almost immediately to the upside and continuing until it found the resistance near 1.08245. Soon, the pair retraced to the 61.8% of the move and stayed on the sideways path.
 GBPUSD (14.05.2024) 15m Chart Summary
Server Time / Timezone EEST (UTC+03:00)
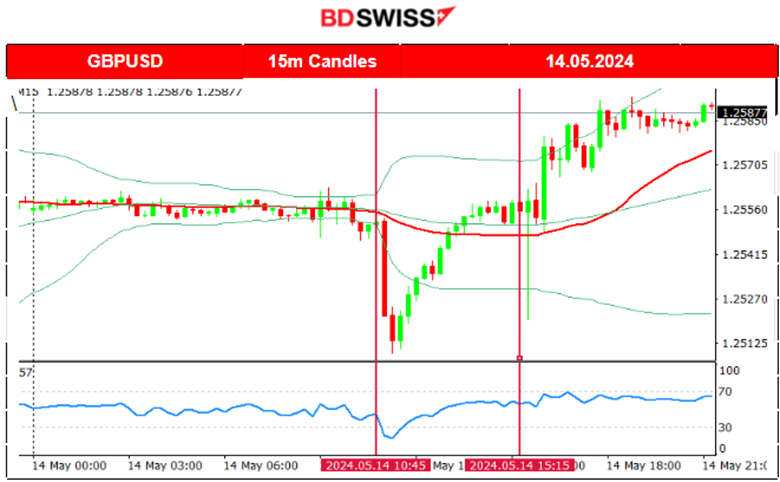
Price Movement
The pair was moving sideways with very low volatility before 9:00. At that time that changed with the release of the U.K. Claimant Count, average earnings growth and monthly unemployment rate figure releases that caused high GBP depreciation. The pair dropped near 40 pips before eventually reversing fully back to the 30-period MA. Volatility kicked in again with the release of the U.S. PPI news that caused dollar appreciation and an immediate depreciation that followed causing the GBPUSD pair to drop near 40 pips and reverse almost immediately to the upside. With the dollar weakening to hold the pair stayed close to higher levels until the end of the trading day.
___________________________________________________________________
CRYPTO MARKETS MONITOR
BTCUSD (Bitcoin) Chart Summary 1H
Server Time / Timezone EEST (UTC+03:00)
Price Movement
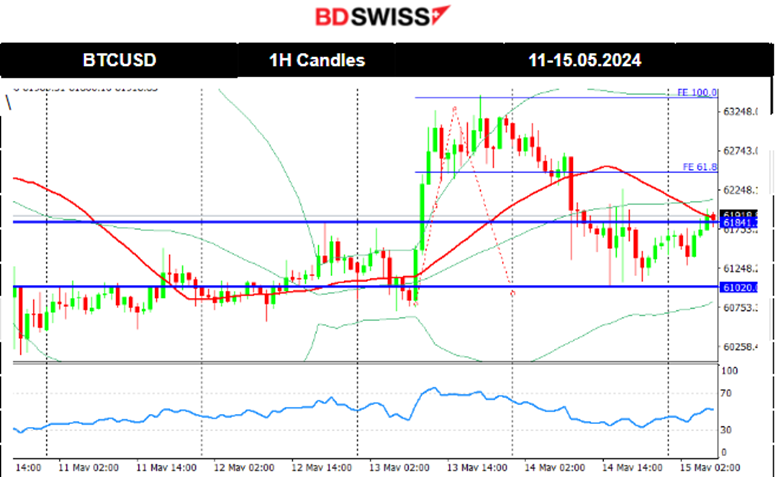
On the 10th of May, Bitcoin saw a huge drop after the news release at 17:00 causing the sudden U.S. dollar strengthening and the trigger of a risk-off mood. After that event, the price continued with an upward steady movement within a channel as depicted on the chart.
That channel formation was broken on the 13th of May with Bitcoin jumping, correcting fully from the drop on the 10th of May. After the price reached the resistance at near 63,285 it retraced to the 30-period MA and the 61.8 Fibo level.
On the 14th of May, the price continued with a reversal to the downside, crossing the 30-period MA on its way down and reaching against the support area near the 61K USD before retracing eventually to the MA.
 Crypto sorted by Highest Market Cap:
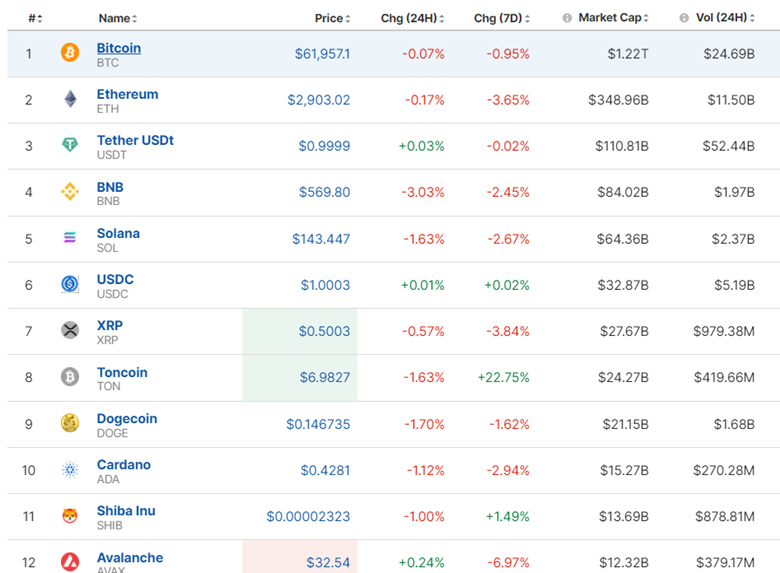
Cryptos lost ground after the news release on the 10th of May that showed the fall in U.S. consumer sentiment and a rise in inflation expectations. The market bounced back, correcting from that drop and eliminating some losses but we see now that a reversal to the downside on the 14th of May wipes out the correction’s gains and keeps prices low. Toncoin for the last 7 days maintains a strong performance of 22.75%.
Source: https://www.investing.com/crypto/currencies
______________________________________________________________________
EQUITY MARKETS MONITOR
S&P500 (SPX500) 4-Day Chart Summary
Server Time / Timezone EEST (UTC+03:00)
Price Movement
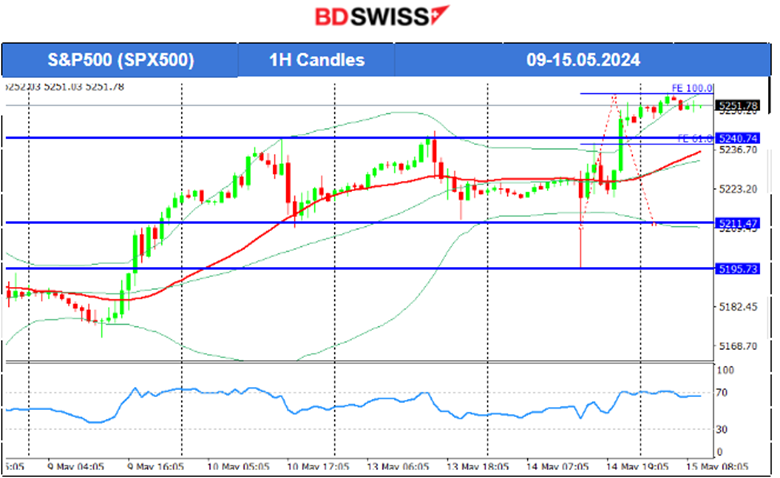
A triangle formation is apparent when moving into the 9th of May. That triangle formation broke as the price moved to the upside after the U.S. Unemployment claims figure release, causing indices to experience a jump. On the 10th of May, the index dropped upon release of the U.S. news for Consumer sentiment and inflation expectations. That news release caused dollar appreciation at that time and the index to fall around 20 dollars. It eventually reversed to the upside steadily after touching the 30-period MA and the 61.8 Fibo level. The PPI news on the 14th of May caused a breakout of the support near 5,211 USD causing the index to drop to 5,195 USD before it reversed immediately to the upside. This happened due to the dollar effect, we saw that the dollar index reversed immediately as well to the downside at that time. The level 5,240 USD was quite significant for resistance and that was broken on the 14th of May after the index’s continuation to the upside. The other indices experienced similar paths.
 ______________________________________________________________________
COMMODITIES MARKETS MONITOR
USOIL (WTI) 4-Day Chart Summary
Server Time / Timezone EEST (UTC+03:00)
Price Movement
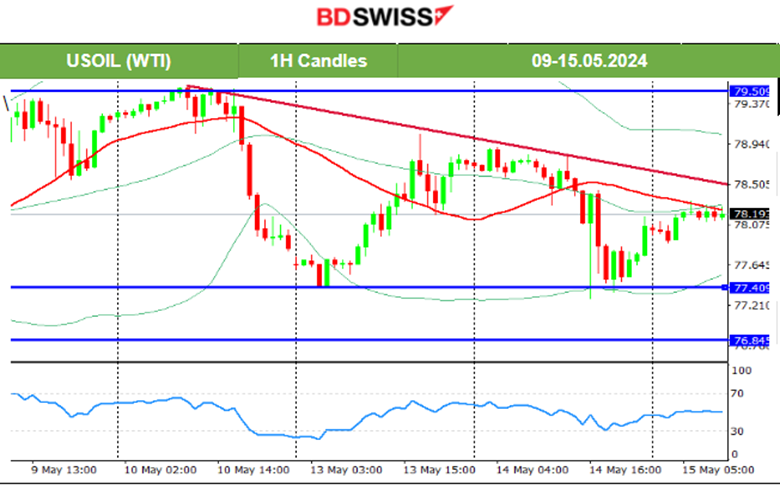
The price dropped heavily on the 10th of May after the U.S. Unemployment claims news at 17:00, a near 2-dollar drop to 77.37 before retracement started to take place. An upward movement took place as expected and mentioned in our previous analysis. The price retraced to the 30-period MA and went even beyond, crossing it on the way up and reaching the resistance at near 79 USD/b. A triangle formation is apparent and its breakout could lead to rapid moves in either direction depending on the breakout. The path is quite volatile for Crude oil. On the 14th of May, the PPI news caused its price to drop and test again the support at near 77.40 USD/b before it eventually retraced to the 30-period MA. A breakout to the upside could lead to the price to reach 79.5 USD/b rapidly. A breakout to the downside could lead to the price to reach 76.85 USD/b.
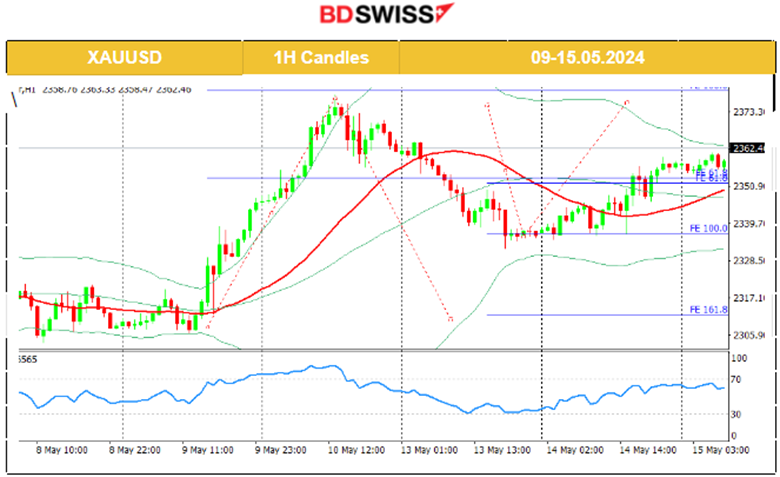
 XAUUSD (Gold) 4-Day Chart Summary
Server Time / Timezone EEST (UTC+03:00)
Price Movement
The price reached a peak at 2,378 USD/oz, on Friday 10th of May, before retracing to the 61.8 Fibo level at near 2,350 USD/oz. On the 13th of May, the price crossed the 30-period MA on its way down signalling the end of the uptrend or even a change in trend. The price moved downwards and the support near 2,332 USD/oz was reached before the retracement took place back to the MA, close to 2,345 USD/oz. On the 14th of May, the support held and the price reversed to the upside correcting from the drop. Gold crossed the MA on its way up and moved higher to the resistance at 2,360 USD/oz. The dollar weakening helped gold to stay higher and now it could reach the 2,378 USD/oz peak gain if the CPI are favourable for U.S. dollar weakening.
 ______________________________________________________________
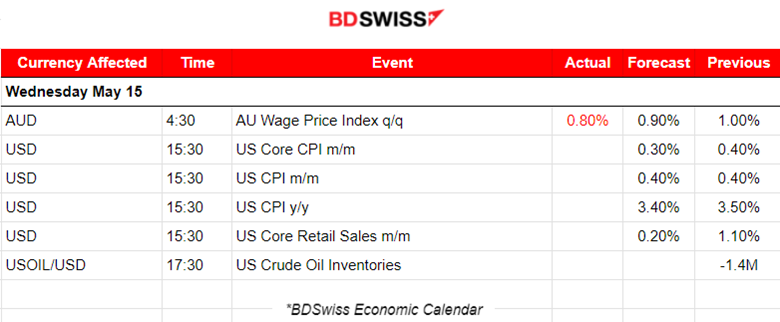
News Reports Monitor – Today Trading Day (15 April 2024)
Server Time / Timezone EEST (UTC+03:00)
- Midnight – Night Session (Asian)
In Australia, the seasonally adjusted Wage Price Index (WPI) rose 0.8% this quarter and 4.1% over the year. The market has not reacted significantly to the news. AUD depreciation was only momentarily. An 8-pip drop of the AUDUSD was observed. The pair reversed immediately to the upside.
- Morning – Day Session (European and N. American Session)
The most important news of the week will take place at 15:30: CPI data for the U.S. and it is expected that we will see a decline in inflation figures. This report follows after the higher-than-expected PPI figures, released yesterday, that puzzled the market and caused the dollar to weaken.
Core retail sales in the U.S., released at the same time, are expected to have seen a huge growth decline last month. This is somehow expected considering the recent data that suggested the labour market is cooling.
The USD pairs will be affected greatly by an intraday shock. If there are no surprises, the initial reaction should be further dollar depreciation.
General Verdict:
______________________________________________________________


