

Previous Trading Day’s Events (12 Jan 2024)
“The inflation pipeline is clearing and consumer prices will gradually get to the Fed’s 2% target,” said Jeffrey Roach, chief economist at LPL Financial in Charlotte, North Carolina.
The PPI has now declined for three consecutive months.
Financial markets remain hopeful that the Fed will start cutting interest rates in March, though most economists are leaning towards May or June, given the labour market’s resilience.
Based on the CPI and PPI data, economists estimated the PCE price index excluding food and energy rose 0.2% in December after gaining 0.1% in November and October.
“The key upside risk to inflation is from the war in the Middle East and potential disruptions to trade flows and global energy supplies,” said Bill Adams, chief economist at Comerica Bank in Dallas. “But petroleum and renewables output is growing faster than GDP in the U.S., which so far has offset the impact of geopolitical risk and kept energy prices well behaved.”
Source: https://www.reuters.com/markets/us/us-producer-prices-unexpectedly-fall-december-2024-01-12/
______________________________________________________________________
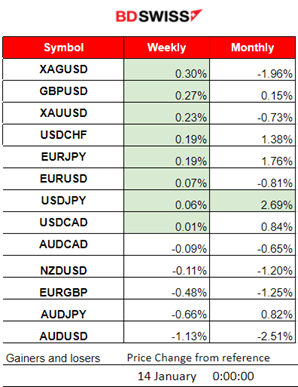
Winners vs Losers
XAGUSD jumped to the top of the winner’s list for the week closing with 0.3%. Gold is also on the top. USDJPY remains the top gainer for the month with a 2.69% price change.
______________________________________________________________________
News Reports Monitor – Previous Trading Day (12 Jan 2024)
Server Time / Timezone EEST (UTC+02:00)
- Midnight – Night Session (Asian)
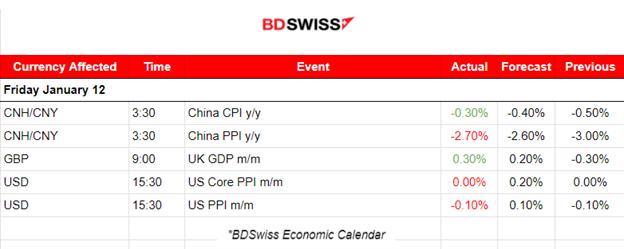
China’s inflation figure was reported at -3%, lower negative than what was expected. Very weak numbers, deflation y/y and barely positive m/m. No major impact was recorded in the market.
- Morning–Day Session (European and N. American Session)
In the U.K. the monthly Real gross domestic product (GDP) is estimated to have grown by 0.3% in November 2023 beating expectations. Services output grew by 0.4% in November 2023 and was the main contributor to the monthly growth in GDP. The release did not have a major impact on the market.
The U.S. PPI data reported at 15:30 showed that the wholesale prices unexpectedly declined in December, providing desirable figures to the Fed that target price reduction. The producer price index (PPI) fell 0.1% for the month and ended 2023 up 1% from a year ago beating the expectation of an increase of 1% instead. The core PPI was flat against the estimate for a 0.2% increase. These data are showing opposite directions compared to the CPI data that actually reported increased prices. The market reacted with USD depreciation upon release, however keeping volatility levels at a moderate level. USDJPY fell close to 60 pips at the time of the PPI release.
General Verdict:
 ____________________________________________________________________
FOREX MARKETS MONITOR
EURUSD (12.01.2024) 15m Chart Summary
Server Time / Timezone EEST (UTC+02:00)
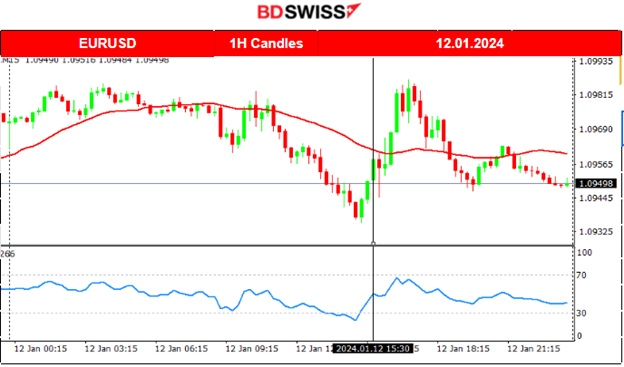
Price Movement
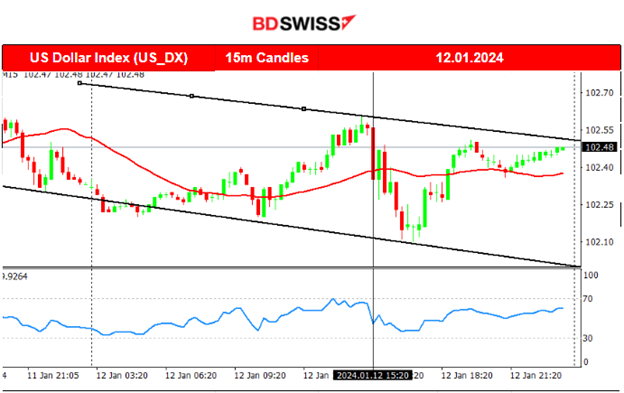
The pair moved to the downside steadily after the start of the European session, the opposite path from the dollar index, indicating that the USD was driving the path with appreciation against the EUR. After 15:30 during the reported lower PPI changes the USD started to depreciate significantly. The EURUSD reversed, crossing the 30-period MA on its way up and reaching the resistance near 1.09860. Retracement followed to the mean with volatility levels lowering and the path remained sideways close to the mean for the rest of the trading day.
 ___________________________________________________________________
CRYPTO MARKETS MONITOR
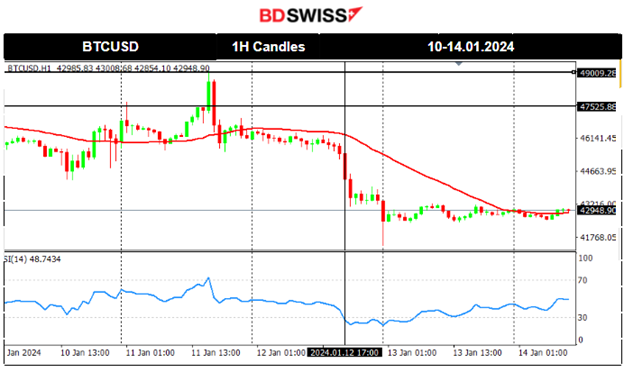
BTCUSD (Bitcoin) 4-Day Chart Summary
Server Time / Timezone EEST (UTC+02:00)
Price Movement
Bitcoin fell lower on the 10th Jan reaching the support at near 44300 USD before reversing, returning back to the MA just before the SEC announcement for approval. U.S. regulators eventually approved Bitcoin ETFs, dramatically broadening access to the 15-year-old cryptocurrency and its price experienced an intraday shock with high volatility. The price eventually settled near 46K USD as volatility calmed. On the 11th though, bitcoin saw an upward movement during the time the inflation report was released, for the U.S. Its price reached the resistance near 49K USD and, soon after, it experienced a sudden drop back to the 30-period MA. It remarkably dropped from the mean near 46K USD and moved a lot lower to the support near 42K USD before retracing to the MA and settling close to the 43 USD level.
Sources:
Crypto sorted by Highest Market Cap:
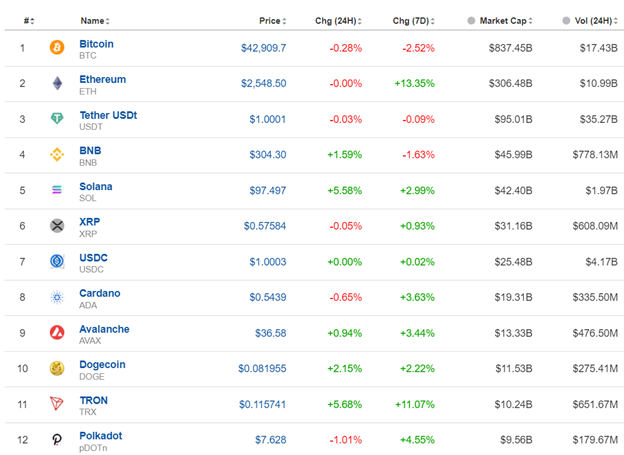
Cryptos are currently in a state of consolidation, prices remained stable after a fall on Friday. The 7-day performance for bitcoin is actually below 0, -2.52% against expectations of an increase instead.
Source: https://www.investing.com/crypto/currencies
______________________________________________________________________
EQUITY MARKETS MONITOR
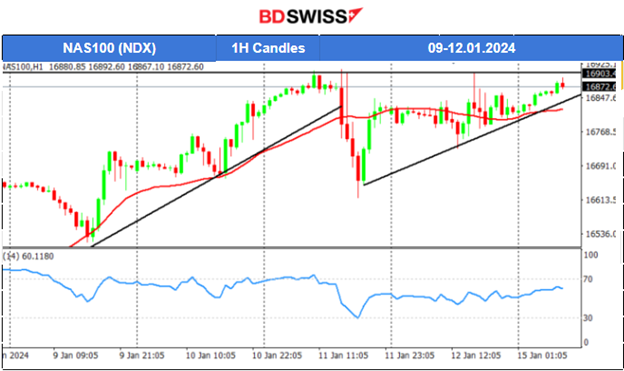
NAS100 (NDX) 4Hour Timeframe Chart Summary
Server Time / Timezone EEST (UTC+02:00)
Price Movement
This week, upon the U.S. inflation data release the uptrend was interrupted and the index dropped sharply, crossing the 30-period MA on its way down, and finding support at 16615 USD before retracing strongly upwards and settling close to the mean. This drop could be attributed to stronger USD at that time and the expectations of borrowing costs to remain elevated for longer than anticipated. On the 12th Jan its price remained close to the mean but now shows signals that the uptrend might return. A triangle formation is apparent and the price tests the 16900 USD resistance. 16950 USD seems to be the next resistance upon the triangle breakout. The alternative scenario is that a breakout to the downside takes place with the next support at 16750 USD.
 ______________________________________________________________________
COMMODITIES MARKETS MONITOR
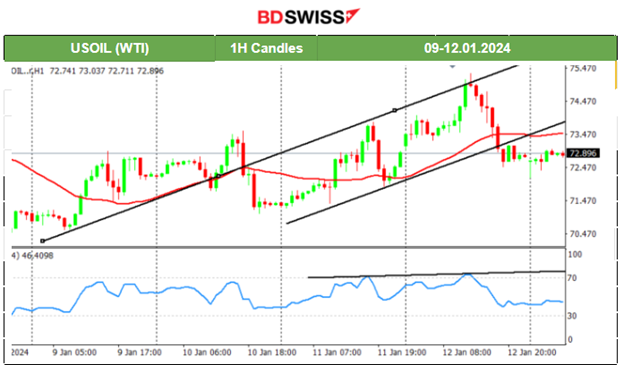
USOIL (WTI) 4-Day Chart Summary
Server Time / Timezone EEST (UTC+02:00)
Price Movement
The resistance at near 74 USD/b was broken on the 12th after Crude’s price tested that level twice this week. Crude reached the strong resistance at 75 USD/b before a heavy reversal took place with the price crossing the 30-period MA on its way down reaching the support near 72 USD/b and settling near 73 USD/b eventually. Considering the volatility of this particular asset, it is probable that retracement to the upside will take place soon before any more downward movement takes place, if any.
XAUUSD (Gold) 4-Day Chart Summary
Server Time / Timezone EEST (UTC+02:00)
Price Movement
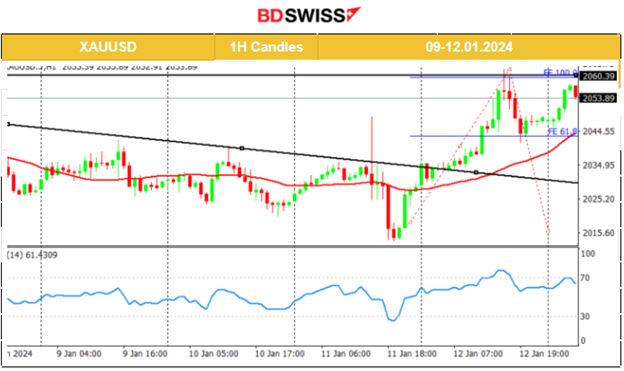
After the U.S. CPI report, Gold moved eventually to the downside significantly breaking the triangle formation, reaching 2013 USD/oz as the dollar was gaining strength. When the dollar experienced weakness during the rest of the trading day, Gold’s price reversed fully, crossing the MA on its way up and remarkably breaking the triangle to the upside. On the 12th Jan the resistance at 2040 USD/oz was broken early, nearly at the start of the trading day it steadily moved to the upside reaching 2060 USD/oz as mentioned in our previous report. That resistance proved to be strong enough causing the price to retrace back to the 61.8 Fibo level.
 ______________________________________________________________
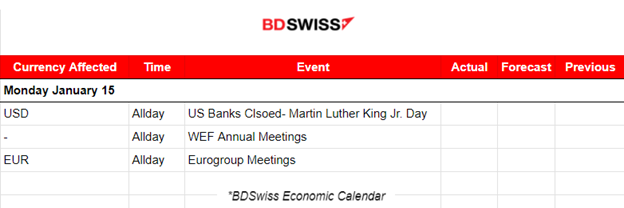
News Reports Monitor – Today Trading Day (15 Jan 2024)
Server Time / Timezone EEST (UTC+02:00)
- Midnight – Night Session (Asian)
No important news announcements, no special scheduled releases.
- Morning–Day Session (European and N. American Session)
No important news announcements, no special scheduled releases.
World Economic Forum annual meetings are held in Davos and attended by central bankers, prime ministers, finance ministers, trade ministers, and business leaders from over 90 countries. Statements to reporters could cause more volatility than normal.
Eurogroup meetings are attended by the Eurogroup President, Finance Ministers from euro area member states, the Commissioner for Economic and Monetary Affairs, and the President of the European Central Bank for coordinating economic policies of the nineteen euro area member states.
General Verdict:
______________________________________________________________


