

Previous Trading Day’s Events (16 Jan 2024)
“The stickiness in these core measures of inflation comes as a disappointment to Canadians hoping to see enough progress today to open the door to rate cuts,” Mendes said.
The annual inflation rate was largely driven by higher gasoline prices compared with the same period a year ago.
“The acceleration of core inflation “speaks to the fact that the Bank of Canada still has some progress that they need to see in order to consider lowering interest rates,” said Andrew Kelvin, chief Canada strategist at TD Securities.
Source: https://www.reuters.com/markets/canadas-inflation-rises-34-dec-meeting-expectations-2024-01-16/
______________________________________________________________________
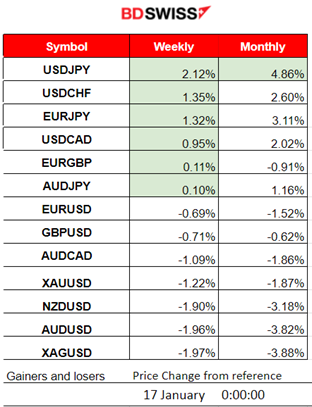
Winners vs Losers
The USD strengthened quite significantly yesterday. USDJPY is on the top of the week’s list with 2.12% gains so far and 4.86% performance for the month.
 ______________________________________________________________________
News Reports Monitor – Previous Trading Day (16 Jan 2024)
Server Time / Timezone EEST (UTC+02:00)
- Midnight – Night Session (Asian)
No important news announcements, no special scheduled releases.
- Morning–Day Session (European and N. American Session)
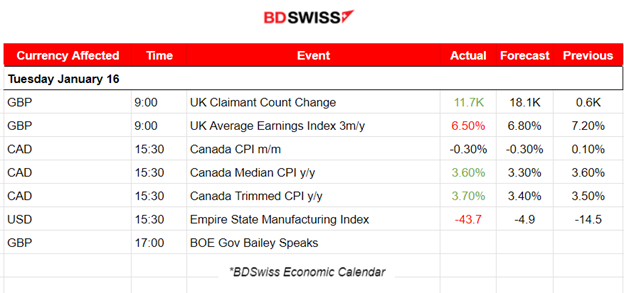
The U.K. reported 11.7K more people claiming unemployment-related benefits in December, a number less than the forecast but way over the previous change of just 0.6K. In October to December 2023, the estimated number of vacancies in the U.K. fell by 49K in the quarter. Vacancies fell in the quarter for the 18th consecutive period. The weak labour market conditions are quite apparent. The annual growth in employees’ average total earnings (including bonuses) was 6.5% from September to November 2023, a figure lower than the forecast and the previously reported figure. The GBP suffered depreciation against other currencies but the impact in the market soon faded and pairs reversed back soon.
At 15:30, Canada’s monthly CPI change figure was released as expected, -0.3%. The other figures were released higher than expected. In addition, the annual inflation rate actually rose 3.4% in December, showing inflation ticked up from 3.1% in November and the market reacted with an intraday shock at that time with CAD appreciating significantly. USDCAD fell near 30 pips during the release but soon reversed back to the intraday MA.
The New York Fed’s Empire State index plunged in January to its lowest level since the pandemic, with a reporting figure of -43.7 against the previous -14.5. Manufacturing business activity surprised the market with a sharp drop in New York State according to the related survey. New orders and shipments posted sharp declines. Unfilled orders continued to shrink significantly, delivery times continued to shorten. Inventories to lower levels. Employment declined. The USD depreciated at the time but the impact of the release was not great.
General Verdict:
 ____________________________________________________________________
FOREX MARKETS MONITOR
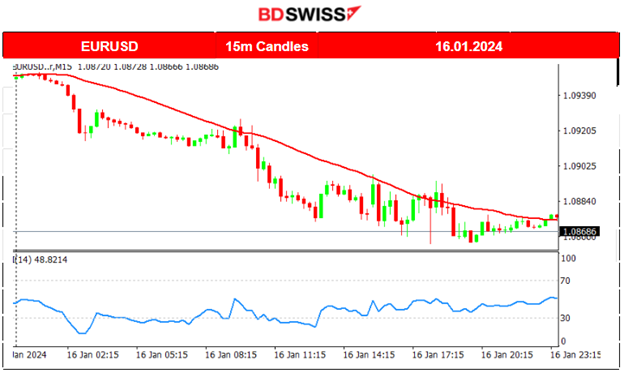
EURUSD (16.01.2024) 15m Chart Summary
Server Time / Timezone EEST (UTC+02:00)
Price Movement
Obviously driven by the USD, the pair moved steadily to the downside. An intraday downward trend. Deviations from the 30-period MA were not so great despite the news.
 ___________________________________________________________________
CRYPTO MARKETS MONITOR
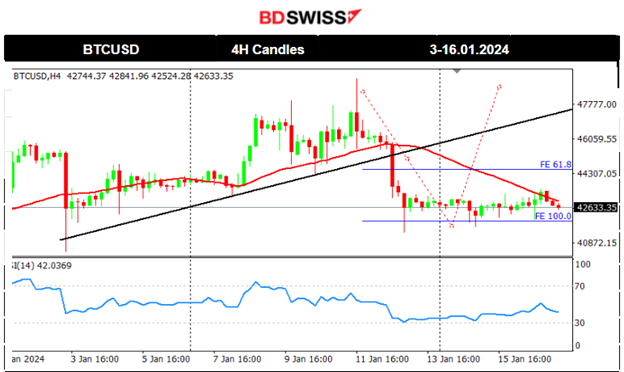
BTCUSD (Bitcoin) Chart Summary 4H Timeframe
Server Time / Timezone EEST (UTC+02:00)
Price Movement
Bitcoin fell lower on the 10th Jan reaching the support at near 44300 USD before reversing, returning back to the MA just before the SEC announcement for approval. U.S. regulators eventually approved Bitcoin ETFs, dramatically broadening access to the 15-year-old cryptocurrency and its price experienced an intraday shock with high volatility. The price eventually settled near 46K USD as volatility calmed. On the 11th though, bitcoin saw an upward movement during the time the inflation report was released, for the U.S. Its price reached the resistance near 49K USD and, soon after, it experienced a sudden drop back to the 30-period MA. It remarkably dropped from the mean near 46K USD and moved a lot lower to the support near 42K USD before retracing to the MA and settling close to the 43K USD level. It has remained in consolidation around this low level since the 13th Jan. We should expect a shock soon, possibly driving the price to the upside.
Crypto sorted by Highest Market Cap:
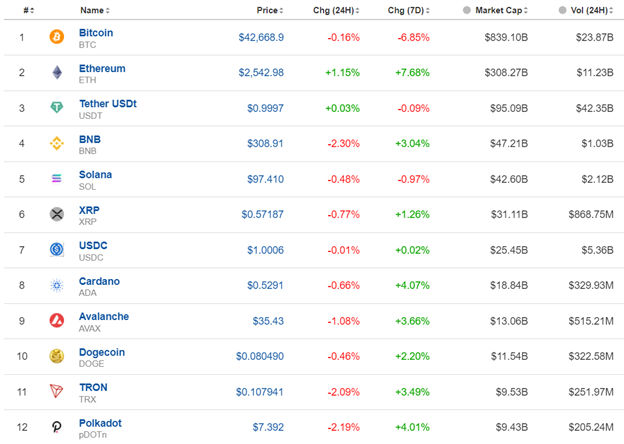
Cryptos are currently in a state of consolidation, prices remained stable at lower levels after a fall on Friday 12th Jan.
Source: https://www.investing.com/crypto/currencies
______________________________________________________________________
EQUITY MARKETS MONITOR
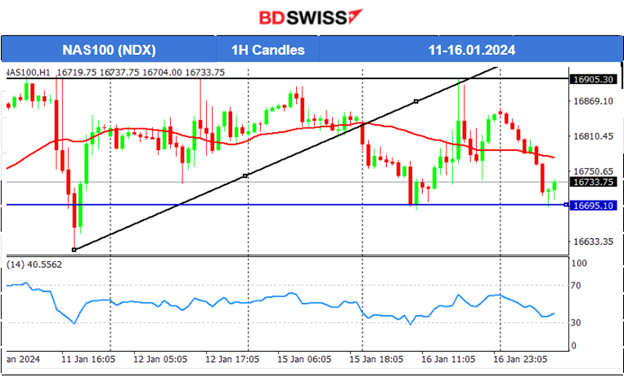
NAS100 (NDX) 4Hour Timeframe Chart Summary
Server Time / Timezone EEST (UTC+02:00)
Price Movement
A breakout to the downside took place on the 16th Jan, breaching the triangle formation, as depicted on the chart. The index moved lower and lower rapidly with the price reaching the support at 16695 USD. The index soon reversed to the upside and tested the resistance at near 16900 USD once more without success after the NYSE opening. Retarcement to the mean followed signalling strong resistance for U.S. stocks currently. All other benchmark indices are experiencing the same resistance as they are staying at lower short-term levels following a downtrend. NAS100 is currently away from the 30-period MA. Even if it moves downward in the future some retracement to the mean should be expected prior. To be more confident in expecting a drop, the breakout of the 16695 USD level should occur, though.
 ______________________________________________________________________
COMMODITIES MARKETS MONITOR
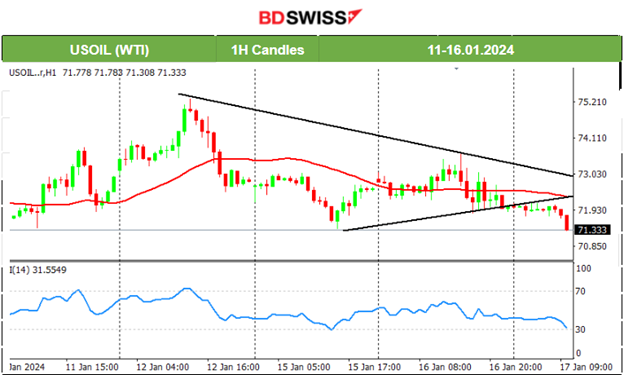
USOIL (WTI) 4-Day Chart Summary
Server Time / Timezone EEST (UTC+02:00)
Price Movement
The resistance at near 74 USD/b was broken on the 12th after Crude’s price tested that level twice this week. Crude reached the strong resistance at 75 USD/b before a heavy reversal took place with the price crossing the 30-period MA on its way down reaching the support near 72 USD/b and settling near 73 USD/b eventually. On the 15th Jan, the price moved even lower, deviating from the mean and reaching near 71.4 USD/b before reversing back to the MA. Currently, Crude oil breaks the lows, signalling a further drop.
XAUUSD (Gold) 4-Day Chart Summary
Server Time / Timezone EEST (UTC+02:00)
Price Movement
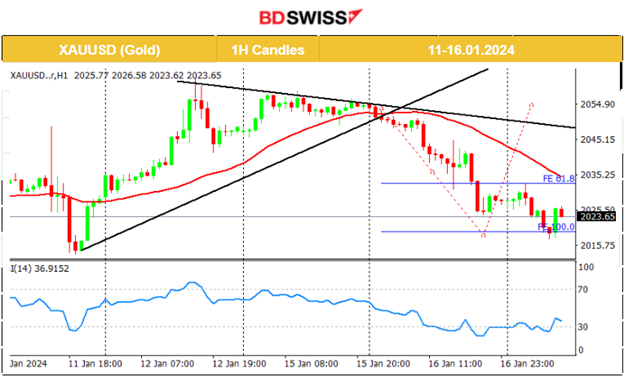
On the 15th Jan Gold remained stable on a sideways path due to low volatility close to the support near 2050 USD/oz. That level was broken however on the 16th Jan with the price dropping rapidly, reaching 2024 USD/oz as the USD appreciated heavily. Retracement to the 61.8 Fibo level did not occur on the same day as the USD strengthened steadily. The next support proved to be 2017 USD/oz, the level at which the price stopped falling on the 16th Jan. This might be the turning point to the upside and retracement occurrence. The RSI supports this view as it forms higher lows when the price shows lower lows, thus we have a bullish divergence.
 ______________________________________________________________
News Reports Monitor – Today Trading Day (17 Jan 2024)
Server Time / Timezone EEST (UTC+02:00)
- Midnight – Night Session (Asian)
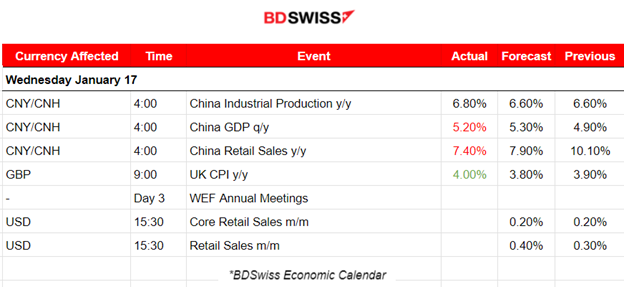
The reports early today during the Asian Session indicated that the yearly figure for calculating industrial production increased in China while the quarterly GDP figure showed a 5.20% growth versus the expected 5.3% but higher than the previous figure. The Retail sales figure was reported lower, however, 7.4% against the expected 7.9%. The Australian Dollar lost a lot of ground after the mixed Chinese data.
- Morning–Day Session (European and N. American Session)
UK’s inflation was reported surprisingly higher at 9:00 to 4%, up from 3.9% in November, and the first time the rate has increased since February 2023. The market reacted with strong appreciation against other currencies. The GBPUSD jumped at the time of the release by nearly 30 pips and continued to move upwards reaching more than 60 pips movement to the upside so far.
Retail Sales reports for the U.S. could cause more volatility for the USD pairs than normal, at 15:30. The market expects higher retail sales figures, a forecast probably correct since the seasonal factors proved to play a role in the economy and spending was strong during the holiday season. The USD pairs could see moderate volatility during that time and more steady movements or retracements from early moves that happened prior to the report releases.
General Verdict:
______________________________________________________________


