

Previous Trading Day’s Events (03.07.2024)
The PMI fell below the 49 level that the ISM, though, says it generally indicates an expansion of the overall economy. The survey’s business activity measure dropped to 49.6, the first contraction since May 2020, from 61.2 in May.
Services inflation slowed a bit last month. The ISM’s prices paid measure for services inputs slipped to 56.3 from 58.1 in May.
Source: https://www.reuters.com/markets/us/us-service-sector-sags-june-orders-sink-2024-07-03/
______________________________________________________________________
Winners vs Losers
Metals stayed on the top this week with rising gains of 3.71% for Silver and 1.13% for Gold. This morning the JPY strengthened unexpectedly but not enough to push the pairs away from the top. The U.S. dollar weakened.
 ______________________________________________________________________
News Reports Monitor – Previous Trading Day (03.07.2024)
Server Time / Timezone EEST (UTC+03:00)

- Midnight – Night Session (Asian)
No important news announcements, no important scheduled releases.
- Morning – Day Session (European and N. American Session)
Services PMI releases:
 Eurozone Services PMIs
Spain’s services sector continued to expand at an above-average pace in June. Positive demand from both domestic and external clients took place. Firms added to their staffing levels at a significant rate. Confidence for future business conditions remained positive. A reported PMI of 56.8, in expansion, shows great potential for the sector.
The Italian service sector expanded again in June despite a slower rate of output growth. Service providers’ confidence grew at high levels. Overall new business picked up. Notable less intense cost pressures at Italian service sector firms.
France’s service sector experienced a further monthly contraction in business activity. The sharpest fall in new orders since January weighed on output. In some cases, survey respondents linked the softening to the uncertainty surrounding July’s general election. Business confidence also weakened, as did job growth. The reported PMI was 49.6 points, in contraction, however, it improved from the previous month.
In Germany, there was a solid rise in business activity in June ending a positive second quarter for the service sector. Firms’ growth expectations for the coming year were at a five-month low. Business costs across the service sector meanwhile rose at the slowest rate since March 2021. The PMI figure was reported at 53.1 in expansion but not improving from last month.
The Eurozone economy continued to grow at the end of the second quarter, although the expansion cooled to a three-month low. New orders decreased for the first time since February though. The latest survey data highlighted a cooling of price pressures across the euro area.
U.K. Services PMI
The U.K. service sector continued to show greater levels of business activity at the end of the second quarter, a sequence of growth to eight months. Despite a reported PMI of 52.1 in expansion, momentum was lost in June, with the upturn at its weakest since November last year as the upcoming general election reportedly led clients to adopt a “wait-and-see” approach before placing orders and commissioning new projects.
U.S. Services PMI
The U.S. service sector in June showed an improvement in growth momentum, with firms seeing sharper increases in both business activity and new orders. Companies increased their workforce for the first time in three months. Rates of increase in both input costs and output prices eased in June.
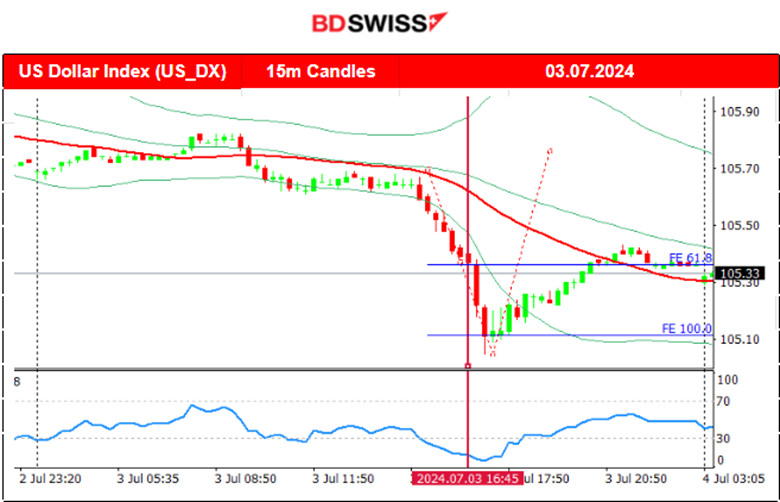
At 15:15, the ADP report showed that private employers added only 150K jobs in June as the labour market slowed. The number was below forecasts for a 160K gain. Signs of cooling ahead of the NFP report. The U.S. dollar started to weaken steadily after the report was released.
The U.S. Unemployment Insurance claims were reported slightly higher at 15:30, indicating that cooling of the labour market could be the real deal. In the week ending June 29, the figure was reported higher at 238K an increase of 4K from the previous week’s revised level.
At 17:00 the ISM Services PMI was reported surprisingly lower, at 48.8 points versus the previous 53.8. From expansion to contraction with a significant deviation from the 50 level that separates the two.
General Verdict:
 __________________________________________________________________
FOREX MARKETS MONITOR
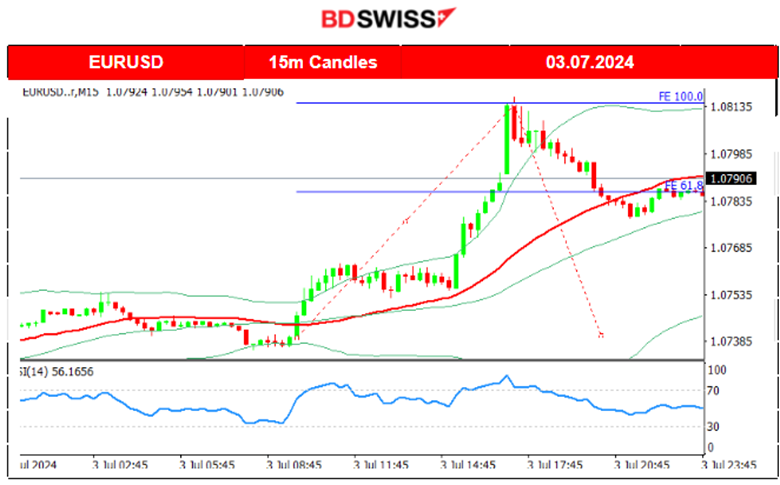
EURUSD (03.07.2024) 15m Chart Summary
Server Time / Timezone EEST (UTC+03:00)
Price Movement
The pair was moving with low volatility upwards as the USD started to show weakness early. After the start of the European session, more dollar weakening caused the pair to move significantly upwards. After 15:30 the USD weakened significantly due to the release of important figures related to the labour market and business conditions in the U.S. causing a jump of the pair to the upside until it found resistance at near 1.08135. The pair eventually retraced to the 30-period MA.
 ___________________________________________________________________
CRYPTO MARKETS MONITOR
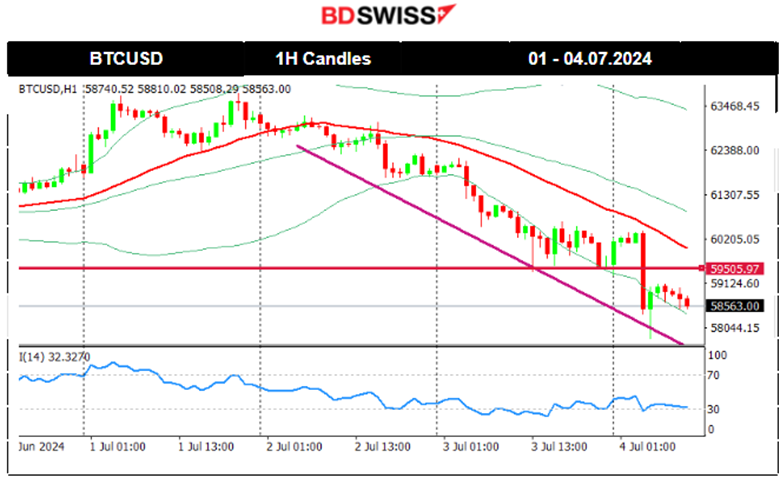
BTCUSD (Bitcoin) Chart Summary 1H
Server Time / Timezone EEST (UTC+03:00)
Price Movement
On the 2nd of July, a clear and steady downtrend took place that resulted in Bitcoin breaking more and more support levels, eventually reaching the 60,500 USD support level. On the 3rd of July, the price dropped further, reaching 60K USD. July 4th finds Bitcoin even lower breaking another support and reaching 58K, which is a crucial support level. A clear downtrend for now.
 Crypto sorted by Highest Market Cap:
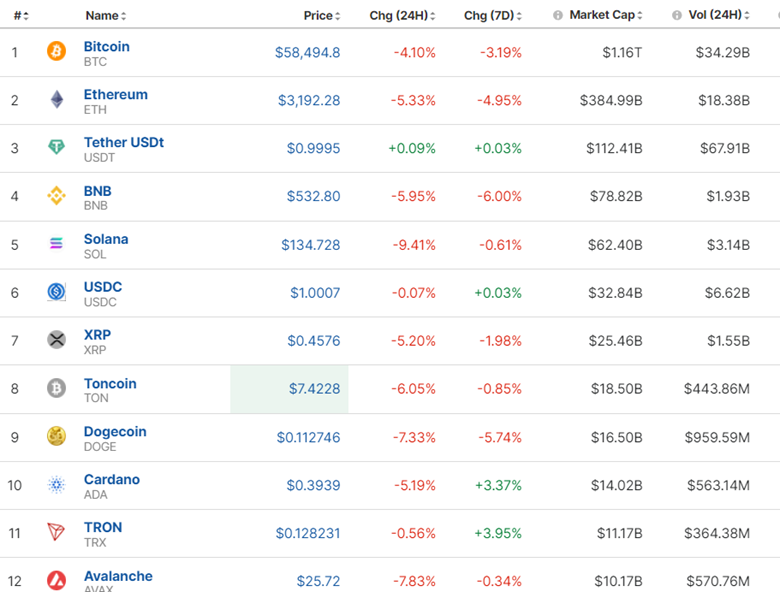
The 2nd of July was deterministic for Crypto. Most Crypto suffered losses and this extends until today as the market has experienced a strong downtrend recently.
https://www.investing.com/crypto/currencies
______________________________________________________________________
EQUITY MARKETS MONITOR
S&P500 (SPX500) 4-Day Chart Summary
Server Time / Timezone EEST (UTC+03:00)
Price Movement
The index eventually moved to the upside on the 2nd of July as it was unsuccessful in breaking the support and broke the triangle formation instead on the upside. It crossed the MA on its way up with an overall 60 USD jump. No retracement has taken place on the 2nd. The 5,500 USD was broken as well and on the 3rd of July, it acted as a strong support. The index jumped after the market opening, reaching the resistance at 5,545 USD and marking the second day in a row without retracement to the 30-period MA. Quite unusual but a signal of a strong momentum to the upside.
 ______________________________________________________________________
COMMODITIES MARKETS MONITOR
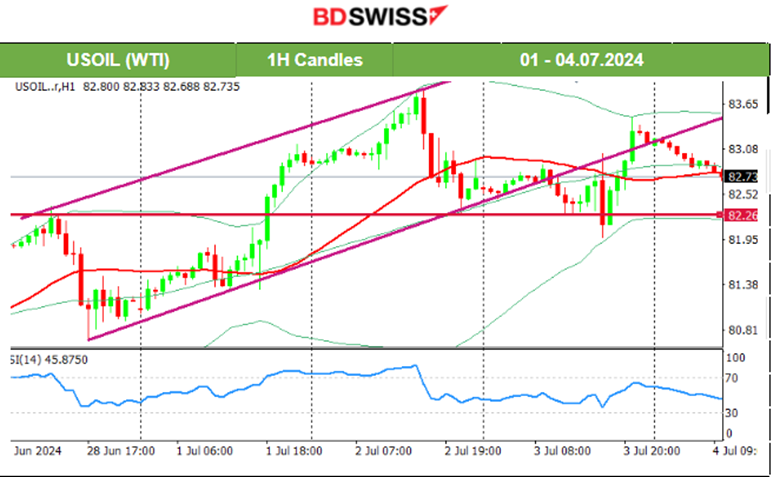
USOIL (WTI) 4-Day Chart Summary
Server Time / Timezone EEST (UTC+03:00)
Price Movement
Since the 1st of July a new trend started with the price reaching 83 USD/b. On the 2nd however, the price retraced to the 30-period MA testing the 82.3 USD/b support. Despite the breakout of that support and the channel that formed, there was not a significant downside movement. The support still holds and the price moves sideways around the mean for now. There is no clear indication of whether the price will be headed until we see a clear breakout of that support.
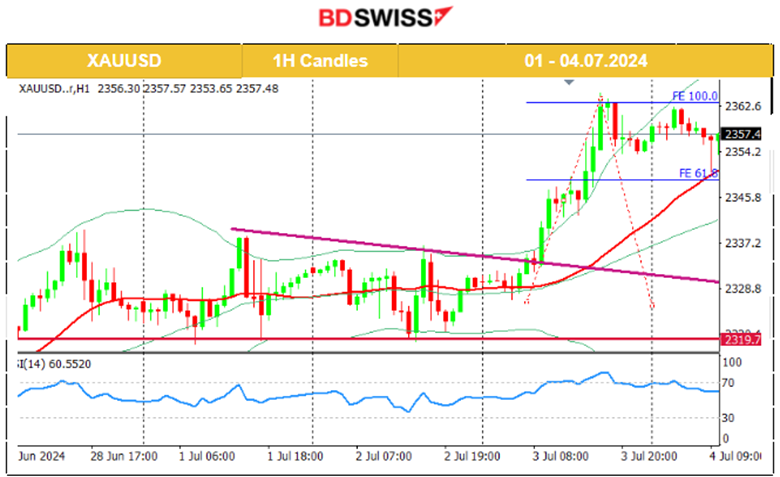
 XAUUSD (Gold) 4-Day Chart Summary
Server Time / Timezone EEST (UTC+03:00)
Price Movement
On the 28th the price experienced volatility but closed near flat. After a long sideways path, a consolidation that lasted for almost 3 days, gold jumped to the upside on the 3rd of July with a target level of 2355 USD/oz. The momentum was strong enough to cause the price to reach 2,365 USD/oz before retracement eventually took place and the price reached back to the 30-period MA.
 ______________________________________________________________
News Reports Monitor – Today Trading Day (04.07.2024)
Server Time / Timezone EEST (UTC+03:00)

- Midnight – Night Session (Asian)
No important news announcements, no important scheduled releases.
- Morning – Day Session (European and N. American Session)
The consumer price index (CPI) remained unchanged in June 2024 compared with the previous month. CHF depreciated heavily at the time of the release. USDCHF jumped nearly 40 pips at that time.
It’s the 4th of July Holiday today. Equities, US/Stocks are closed for trading.
General Verdict:
______________________________________________________________


