

PREVIOUS TRADING DAY EVENTS –23 Oct 2023
______________________________________________________________________
Winners and Losers
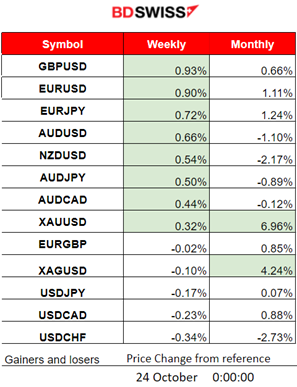
News Reports Monitor – Previous Trading Day (23 Oct 2023)
Server Time / Timezone EEST (UTC+03:00)
- Midnight – Night Session (Asian)
No major announcements, no significant scheduled figure releases.
- Morning–Day Session (European and N. American Session)
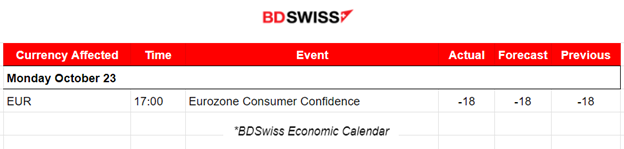
The Eurozone’s Consumer Confidence figure was reported the same as expected, -18 indicating the same pessimism about economic conditions. No major impact was recorded upon release.
General Verdict:
____________________________________________________________________
FOREX MARKETS MONITOR
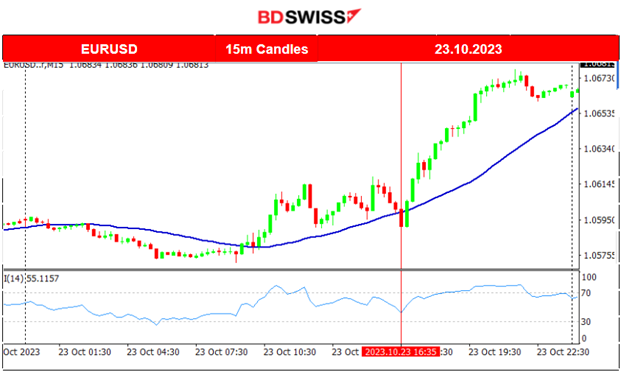
EURUSD (23.10.2023) Chart Summary
Server Time / Timezone EEST (UTC+03:00)
Price Movement
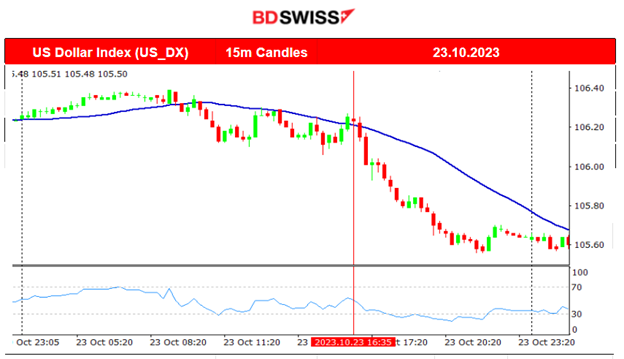
The pair saw some unusual volatility after the European Markets opening. The absence of important special releases gave no room for intraday shocks. The USD however, started to lose strength steadily after 16:30 and so the pair moved to the upside with a normal pace until it found resistance at near 1.06770.
 ___________________________________________________________________
CRYPTO MARKETS MONITOR
BTCUSD (Bitcoin) 4-Day Chart Summary
Server Time / Timezone EEST (UTC+03:00)
Price Movement
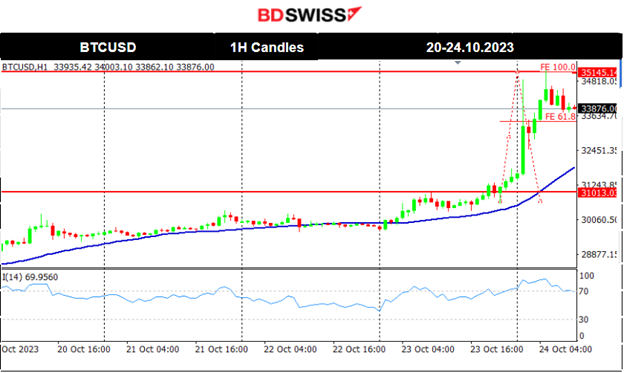
Bitcoin and several cryptocurrencies and related stocks such as Coinbase Global (COIN), Marathon Digital Holdings (MARA), Riot Platforms (RIOT) and Microstrategy (MSTR) experienced a surge in value after a U.S. appeals court ordered the Securities and Exchange Commission to review Grayscale’s application for a spot Bitcoin ETF. Bitcoin has moved significantly to the upside breaking all important resistance levels reaching even until near the level of 35,200 USD. That was the level at which the rapid surge in price finally ended with its price soon retraced after that. However, it did not return to the 30-period MA yet. It is possible that we might see a further drop within a short period of time before any other major moves take place.
Crypto sorted by Highest Market Cap:
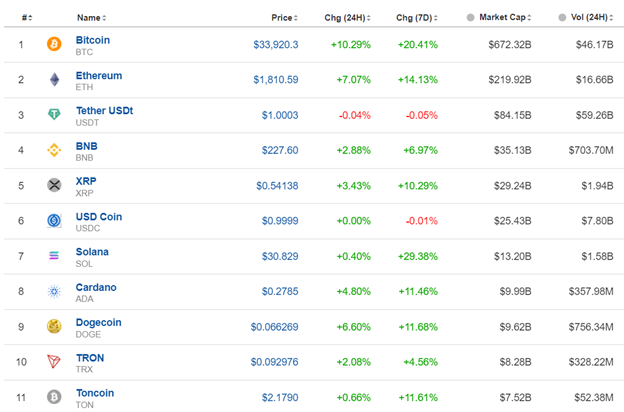
Bitcoin shows 10% gains for the last 24 hours. Ethereum 7% gains. Solana has the highest gains for the past 7 days with nearly 30% price change so far.
Source: https://www.investing.com/crypto/currencies
______________________________________________________________________
EQUITY MARKETS MONITOR
NAS100 (NDX) 4-Day Chart Summary
Server Time / Timezone EEST (UTC+03:00)
Price Movement
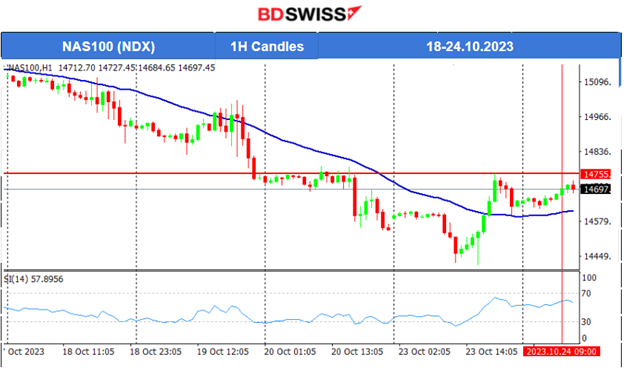
We saw last week that the downside prevailed as the U.S. stock market was suffering losses continuously. All benchmark indices followed the same path to the downside. NAS100 crashed when it broke significant support levels. It finally found resistance near 14400 USD and for the first time in days, it moved significantly to the upside with a strong reversal. It crossed the 30-period MA on its way up signalling that probably the downward trend has ended. Further upward resistance breakouts could spark a rapid price movement to the upside.
 ______________________________________________________________________
COMMODITIES MARKETS MONITOR
USOIL (WTI) 4-Day Chart Summary
Server Time / Timezone EEST (UTC+03:00)
Price Movement
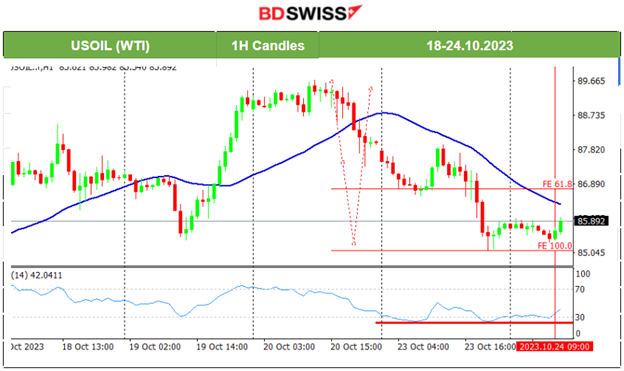
On the 19th of Oct, Crude’s price moved rapidly to the upside reversing significantly and crossing the MA on its way up reaching the next resistance at 89.4 USD/b. It eventually retraced to 88 USD/b as per the forecast in the previous report. After that, the path downwards continued and the price dropped aggressively, reversing and crossing the 30-period MA on its way down until finding resistance at near 85.10 USD/b. Retracement after this long reversal is imminent. The RSI is also supporting the next short-term upward movement with steady lows.
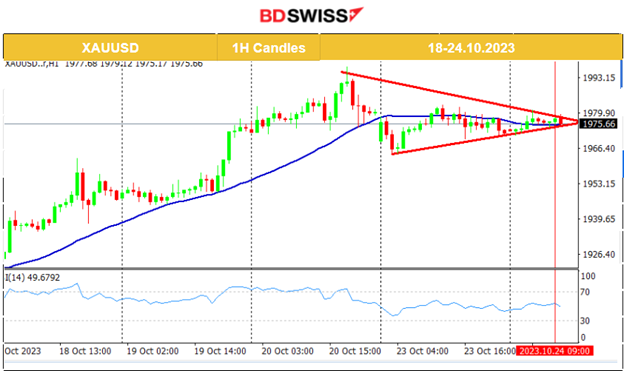
XAUUSD (Gold) 4-Day Chart Summary
Server Time / Timezone EEST (UTC+03:00)
Price Movement
The price was moving to the upside rapidly reaching the next resistance at nearly 1960 USD/oz by the 18th of Oct. That resistance broke and Gold moved further upward reaching 1980 USD/oz. On Friday, it continued with the upside movement until it reached near the important psychological resistance level at 2000 USD/oz before retracing. It is quite remarkable that fundamentals are pushing Gold to higher and higher levels. While tensions and warfare still exist, market participants are buying more safe-haven metals, ditching risky assets such as stocks. Currently, the price of gold forms a triangle as volatility eases. It settled near 1975 USD/oz and waits to break the triangle on either side. Potential rapid movement after breakout is estimated to be at least 20-25 USD.
______________________________________________________________
News Reports Monitor – Today Trading Day (24 Oct 2023)
Server Time / Timezone EEST (UTC+03:00)
- Midnight – Night Session (Asian)
No major announcements, no significant scheduled figure releases.
- Morning–Day Session (European and N. American Session)
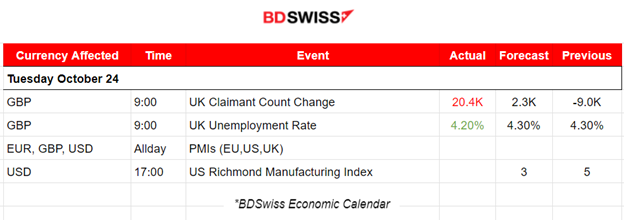
The Claimant Count Change (Jobless claims) was remarkably reported at 20.4K versus the expected increase of just 2.3K. That is a further indication that elevated interest rates have a great impact on the U.K.’s labour market. On the other hand, the Unemployment Rate improved to 4.20% against the previous 4.30%
At the time of the release, no significant shock was recorded affecting GBP pairs.
PMI releases for both the Manufacturing and the Services sector take place today. Increased volatility is expected especially at the time of the release. EUR is already showing signs of strong depreciation with the release of the PMI figures for the eurozone.
The Richmond Manufacturing Index could potentially have a good effect on the USD pairs upon release but we do not expect a shock at that time since manufacturing data are reported prior.
General Verdict:
______________________________________________________________


