

Previous Trading Day’s Events (11 Jan 2024)
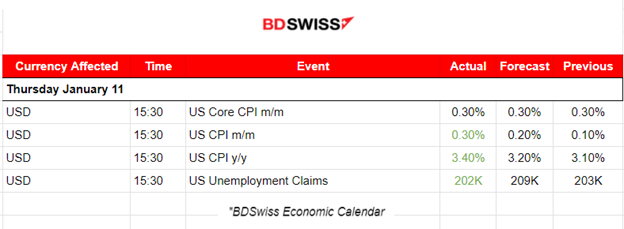
The monthly Inflation figure rose 0.3% in December after increasing 0.1% in November. The yearly Inflation figure rose 3.4%, more than the 3.2% forecast.
U.S. central bankers want more confirmation that inflation is going toward their 2% goal before they reduce the policy rate, now in the 5.25%-5.5% range.
“The upshot of today’s inflation report is that the inflation dragon, while maimed, has yet to be slain,” said Jason Pride, Chief of Investment Strategy and Research at Glenmede.
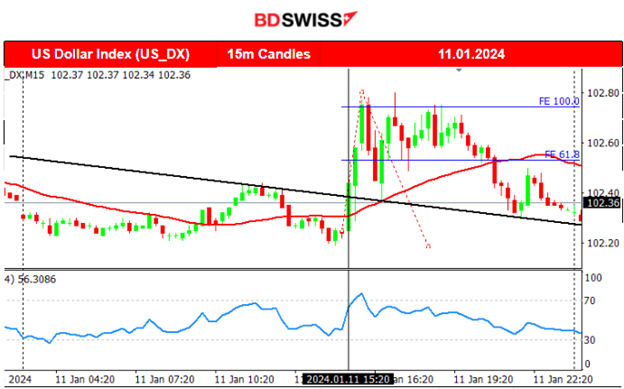
The dollar index, remarkably, remained stable after a quite volatile trading day. One-side direction movements did not hold for most assets.
______________________________________________________________________
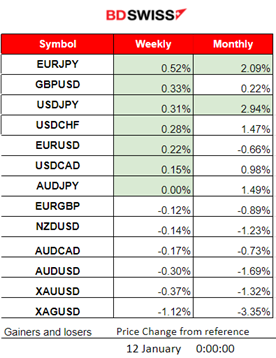
Winners vs Losers
EURJPY remains on the top of the winner’s list for the week with 0.52% gains. Even though the USD strengthened remarkably after the U.S. Inflation report, soon after it experienced heavy depreciation against other currencies. The dollar index reversed fully back to the downside closing almost flat.
 ______________________________________________________________________
News Reports Monitor – Previous Trading Day (11 Jan 2024)
Server Time / Timezone EEST (UTC+02:00)
- Midnight – Night Session (Asian)
No important news announcements, no special scheduled releases.
- Morning–Day Session (European and N. American Session)
At 15:30, U.S. inflation, the key figure for this week, was reported higher than expected, a surprise that challenged the views for rate cuts soon. With this new data into consideration, the probability for unchanged rates in Jan reaches close to 100% according to CME’s FedWatch tool. The consumer price index (CPI) increased 3.4% in the year through December, the most in three months. On a monthly basis, the figure was also higher than expected but the Core CPI figure was stable, rising 0.3% as expected. On an annual basis, the core measure increased 3.9%. Policymakers were paying close attention to the release of price data as the Federal Reserve has revealed their intentions for rate cuts this year and probably sooner than they should.
Of course, statements commenting on the figures followed. In his statement, President Joe Biden highlighted the fact that the year 2023 ended with inflation significantly lower, with prices of goods and services that are important for American households dropping to desirable levels. This was achieved, he said, while growth and the job market have remained strong. Unemployment claims remain high just above 202K. The NFP was reported way higher than expected last week and the Jobless rate was reported lower than expected, stable at 3.7%.
At the time of the release, an intraday shock took place and the USD appreciated momentarily experiencing a jump and an immediate reversal, a crash. Soon after the CPI figures were released, the Dollar started to gain strength again steadily but with relatively high speed causing it to move significantly upwards before it experienced a fool reversal once more.
General Verdict:
 ____________________________________________________________________
FOREX MARKETS MONITOR
EURUSD (11.01.2024) 15m Chart Summary
Server Time / Timezone EEST (UTC+02:00)
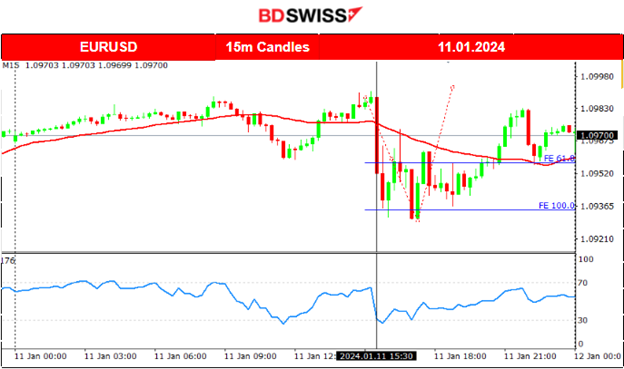
Price Movement
The pair was not showing any significant volatility as the trading volumes were low and market participants were anxiously waiting for the U.S. inflation report to come out. The report was released at 15:30 causing an intraday shock. The pair saw a sharp drop after some minutes due to USD’s sharp appreciation against the EUR and other currencies. It remained low until the USD finally depreciated heavily, causing the pair to reverse back to the mean and beyond until it closed the trading day almost flat.
 ___________________________________________________________________
CRYPTO MARKETS MONITOR
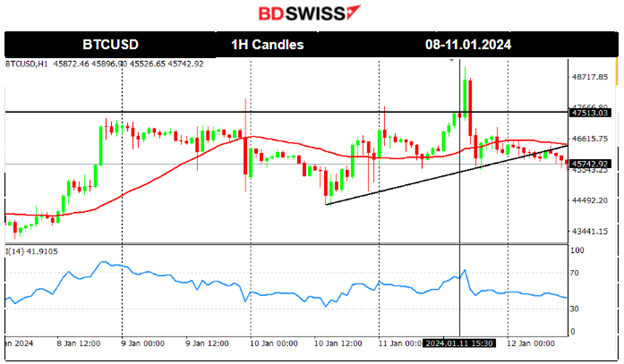
BTCUSD (Bitcoin) 4-Day Chart Summary
Server Time / Timezone EEST (UTC+02:00)
Price Movement
Bitcoin fell lower on the 10th Jan reaching the support at near 44300 USD before reversing, returning back to the MA just before the SEC announcement for approval. U.S. regulators eventually approved Bitcoin ETFs, dramatically broadening access to the 15-year-old cryptocurrency and its price experienced an intraday shock with high volatility. The price eventually settled near 46K USD as volatility calmed. On the 11th though, bitcoin saw an upward movement during the time the inflation report was released, for the U.S. Its price reached the resistance near 49K USD and, soon after, it experienced a sudden drop back to the 30-period MA. It is currently trading at the mean near 46K USD.
Sources:
Crypto sorted by Highest Market Cap:
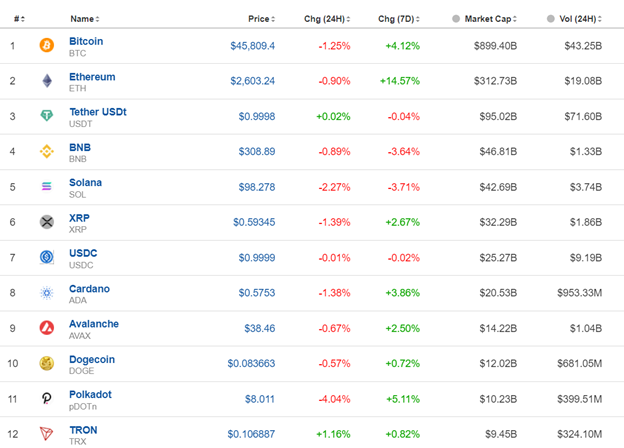
Cryptos show losses in the past 24 hours as the market reversed from the highs. One should expect that Cryptos would start to pick up after the ETF approval, however we do not see any significant performance yet. Etherum holds the 7 day gains over 14.5%.
Source: https://www.investing.com/crypto/currencies
______________________________________________________________________
EQUITY MARKETS MONITOR
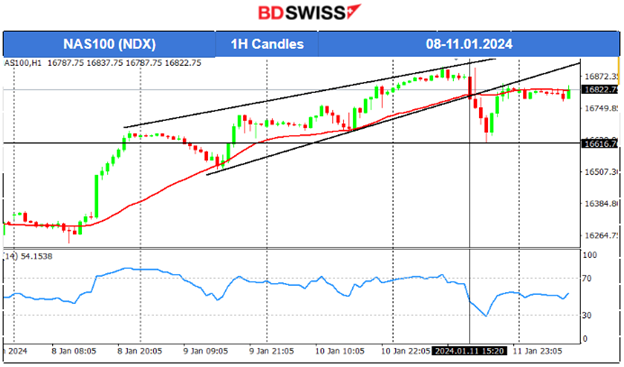
NAS100 (NDX) 4Hour Timeframe Chart Summary
Server Time / Timezone EEST (UTC+02:00)
Price Movement
This week, it was apparent that an uptrend was formed in regards to U.S. indices price paths. On the 8th Jan the index saw a rapid movement to the upside followed by a retracement to the 30-period MA. It then continued to move upwards steadily until the 11th Jan. Upon the U.S. inflation data release it dropped sharply crossing the MA on its way down and finding support at 16615 USD before retracing strongly upwards and settling close to the mean. This drop could be attributed to stronger USD at that time and the expectations of borrowing costs to remain elevated for longer than anticipated. In any case, technically the uptrend was interrupted.
 ______________________________________________________________________
COMMODITIES MARKETS MONITOR
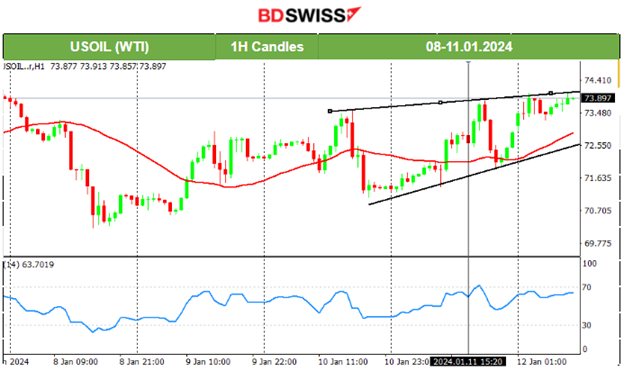
USOIL (WTI) 4-Day Chart Summary
Server Time / Timezone EEST (UTC+02:00)
Price Movement
Crude Oil remains above the 30-period MA and after testing several times it manages to break them without experiencing any significant movements. This caused the price to form an upward wedge as depicted on the chart. Current resistance remains at near 74 USD/b and the price is away from the MA significantly. We might see some reversal back to the MA before any upward movement. Any breakout of the resistance and thus wedge could mean a jump potentially to 74.5USD/b or even 75 USD/b.
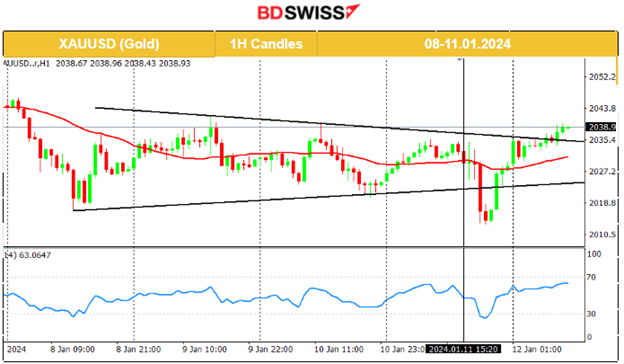
XAUUSD (Gold) 4-Day Chart Summary
Server Time / Timezone EEST (UTC+02:00)
Price Movement
After yesterday’s price data release, the U.S. Gold moved eventually to the downside significantly breaking the triangle formation, reaching 2013 USD/oz as the dollar was gaining strength. When the dollar experienced weakness during the rest of the trading day, Gold’s price reversed fully, crossing the MA on its way up and remarkably breaking the triangle to the upside. It now tests the important resistance at 2040 USD/oz with 2050 USD/oz being the next possible target and next resistance level.
 ______________________________________________________________
News Reports Monitor – Today Trading Day (11 Jan 2024)
Server Time / Timezone EEST (UTC+02:00)
- Midnight – Night Session (Asian)
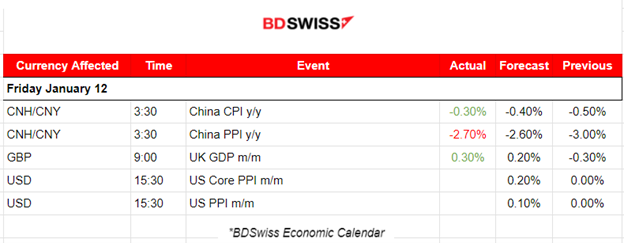
China’s inflation figure was reported at -3%, lower negative than what was expected. Very weak numbers, deflation y/y and barely positive m/m. No major impact was recorded in the market.
- Morning–Day Session (European and N. American Session)
In the U.K. the monthly Real gross domestic product (GDP) is estimated to have grown by 0.3% in November 2023 beating expectations. Services output grew by 0.4% in November 2023 and was the main contributor to the monthly growth in GDP. The release did not major impact on the market.
General Verdict:
______________________________________________________________


