Rates as of 05:00 GMT
Market Recap
Another day, another disaster. The Dow Jones Industrial Average fell 12.93% yesterday. Just to put things in perspective, the worst day in 1929 was a decline of 12.82%.
The G7 leaders released a joint statement saying that they would do “whatever is necessary to ensure a strong global response” to the COVID-19 crisis. “We resolve to coordinate measures and do whatever it takes, using all policy tools, to achieve strong growth in the G7 economies, and to safeguard against downside risks.” However, the US doesn’t seem to be in any hurry as the Senate won’t vote for a few days on even the half-baked measures that it’s agreed on (see below).
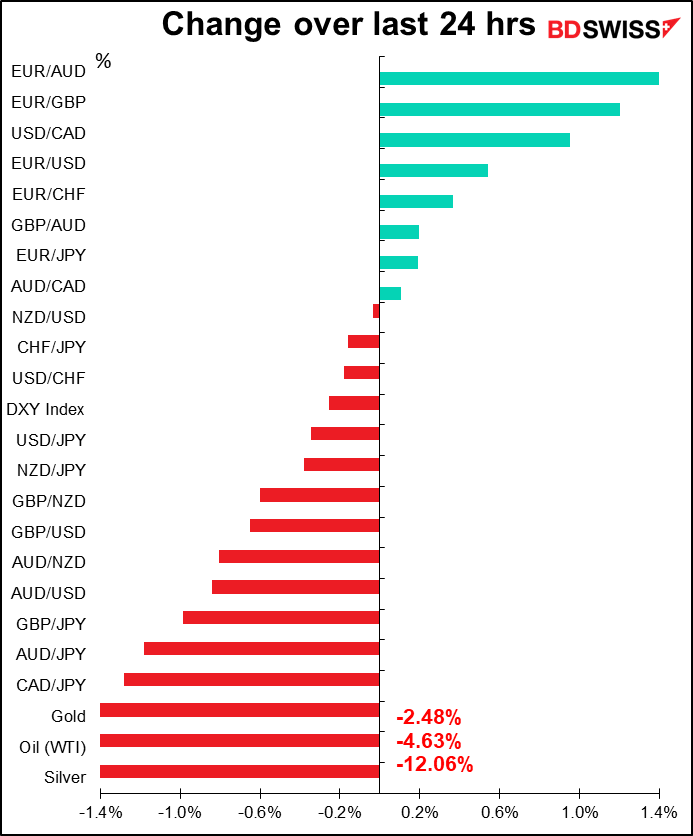
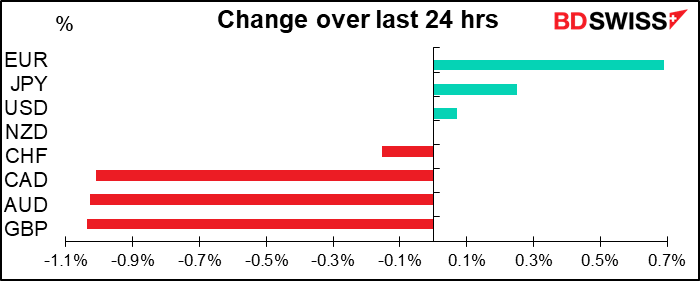
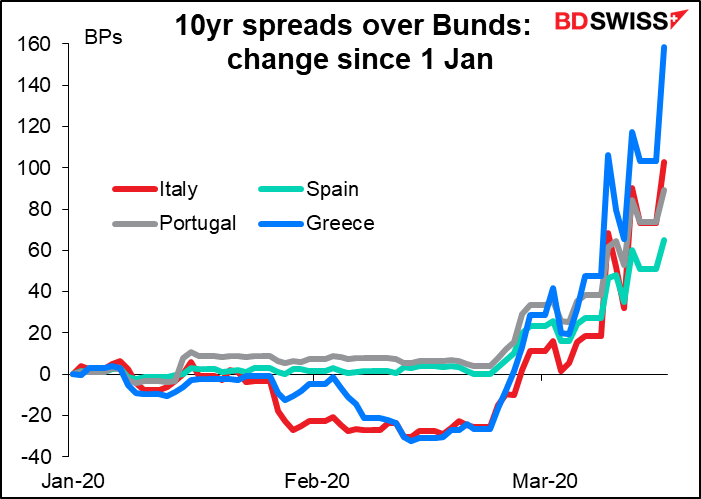
The movement in the FX market was rather surprising to me. Despite what might well be considered the Mother of All Risk-Off Days, JPY and CHF weren’t up that much – CHF actually fell on a trade-weighted basis as EUR was the #1 gainer, perhaps due to unwind of carry trades, narrowing of EUR-USD interest rate differentials, or concerns about US response to the virus? EU leaders met yesterday and took various measures to seal their borders (hmm..what was that about barn doors and horses?) What was noticable though is that they are exploring how to use the European Stability Mechanism’s EUR 410bn lending capacity to cushion the impact. This would be a significant 3.4% of Eurozone GDP, which would certainly go far to ameliorate the problems. Nonetheless, peripheral Eurozone bond spreads continued to widen out, signaling fears about the ability of the group to weather the storm.
On the other hand, it wasn’t surprising to see commodity currencies AUD and CAD fall, the latter in particular being as expected as oil prices fell further.
Also notable was the fact that GBP was (just barely) the biggest loser on a trade-weighted basis, edging out the commodity currencies by a tiny bit. It’s not clear to me what’s specifically driving the GBP weakness. Perhaps it’s amazement at the UK Government’s decision not to take steps to contain the virus? As one medical professional put it on Twitter, what the Government calls “herd immunity” used to be called “survivors.” But PM Johnson seems to have reversed himself; he urged the public to avoid all “non-essential” contact with other people and said mass gatherings should no longer take place. But that’s different from banning them outright. Let’s discuss this down at the pub tonight!
By comparison, NZD was stable despite the sell-off in AUD and CAD after the NZ government announced a stimulus package to counter the impact of the virus. This market reaction confirms to me that investors focusing on government actions and trying to assess how long it’s likely to take for each country to emerge from this crisis. The earlier a country can be expected to recover medically, the earlier its currency is likely to recover too.
This morning though things are looking a bit brighter. Asian stock markets are mixed, with China and South Korea lower but some markets up substantially (Australia +5.8%). S&P 500 futures are indicated up 3.7%. So we might start the day with a little mean reversion and profit-taking on yesterday’s sharp moves.
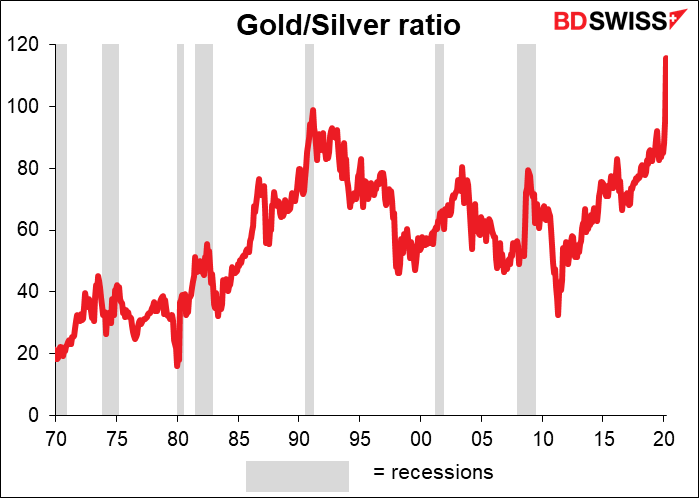
Gold/silver ratio hits record high
One notable point about yesterday’s market was the collapse in silver prices, which caused the gold/silver ratio to hit a record high. And for this one, we have data going back a long, long time – during Pharaoh Menes’ time (circa 3100 BCE) for example the ratio was 2½, whereas in King Hammarabi’s day (circa 1750 BCE) it was 6. We have more frequent data starting at 1687 (courtesy of www.measuringworth.com) that confirms it: yesterday the gold/silver ratio was the highest ever. The ratio peaked at 123.78. As of this morning it’s come back down to 116.41. For reference, on Friday it averaged 101.74, and during all of 2019 it averaged 86.04 (using daily closing values).

It’s not clear to me exactly what drives this ratio. The best correlation I could find was with the 10-year US breakeven inflation rate. But contrary to what one might think, the ratio tends to go up – that is, gold outperforms – when inflation expectations are lower. I thought gold was supposed to be a hedge against inflation? Perhaps this is just the experience of the last 20 years, when inflation hasn’t been much of a problem. Lower expected inflation would mean a) central banks cut their policy rates, and lower interest rates tend to boost the gold price, and b) lower expected inflation probably stems from lower expected economic activity, which might imply less industrial demand for silver – although I must admit I couldn’t find a clear link between industrial activity and the price of silver.
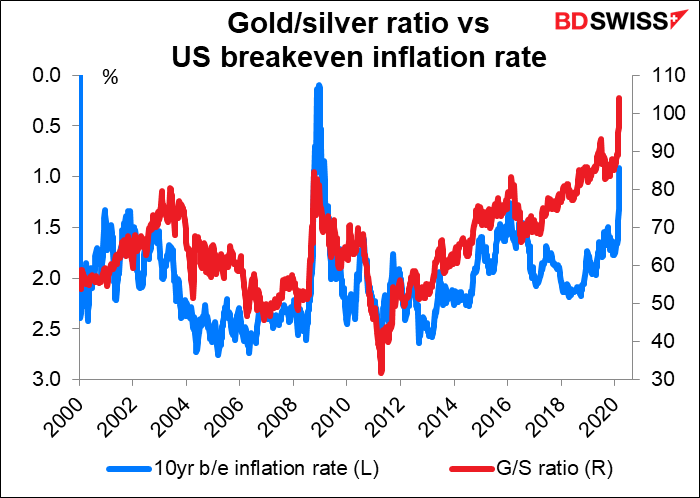
There’s some evidence that the ratio goes up before and during recessions, but it also goes up during times of a healthy economy too, so this is not definitive.
Citibank found that for the period 1Q 2011 to 1Q 2019, “only changes in the yen, excess reserves, and inflation expectations had a statistically significant (p = 0.05) impact on the price ratio of gold-silver.”
In short, I can’t say exactly what has driven this ratio to the highest level in some 5,120 years, but it does prove one thing beyond a doubt: the financial markets are in an extraordinary, unprecedented situation.
The gold market also seems split at the moment. While the price of gold is falling, which obviously demonstrates that there are more sellers than buyers, everything I read on Twitter is that physical gold is nearly unobtainable – that banks and refiners have run out of stocks. Apparently there has been a surge in retail demand for gold coins and bars at the same time as the price has been falling. It seems that the “paper” market, the futures and ETFs, are determining the price and do not reflect the demand on the street for hard metal.
All in all, does this mean silver is a good bet to appreciate vs gold now? Over the longer term, I would think so. A ratio like this cries out for mean reversion. But remember: markets can remain irrational longer than you can remain solvent. I make no claim to understanding exactly why this ratio has hit such an extreme. I’d be reluctant to put on a trade in a market that I don’t understand simply because the levels seem extreme.
Republicans fiddle while America burns: The way the US government works is that the House of Representatives and the Senate have to pass their own versions of a bill, then those bills go into reconciliation where the two houses iron out any differences, then the combined bill goes to the President for his signature. The leaders of the majority party in the House and the Senate control the agenda of each body. Well, Senate Majority Leader “Moscow” Mitch McConnell has declared that he won’t hold a vote on the coronavirus relief package until Wednesday or Thursday. This is after gutting the most necessary provision, namely providing sick pay to lower-paid workers so they can afford to stay home if they get ill rather than staying at work and sneezing on your sandwich. The refusal of the Republican Party to enact the necessary measures to deal with this unprecedented crisis is one of the main reasons why I think the US is doomed to be the worst-affected country in the world from this virus and the dollar is likely to suffer as a result. Also add to that the downright stupid response of many Americans, many of whom are still blaming the Democrats, the Fake News Media, and – gasp, horror! socialism for the crackdown. People wondering what drives responses like this should read about the Dunning-Kruger Effect.
Today’s market
Let me begin this section with a general caveat: the market is now focusing entirely on one macro factor, namely the virus and the reaction to the virus. The impact of that one factor can and will often totally swamp the impact of any economic indicators. The comments that follow assume no change in this overall macro situation, but to tell the truth that’s rather unlikely. Thus I expect the indicators will have only a temporary impact on currencies at best, like the way a rock on a beach might affect the flow of water in the sand a moment or two before a tidal wave comes swooping in.
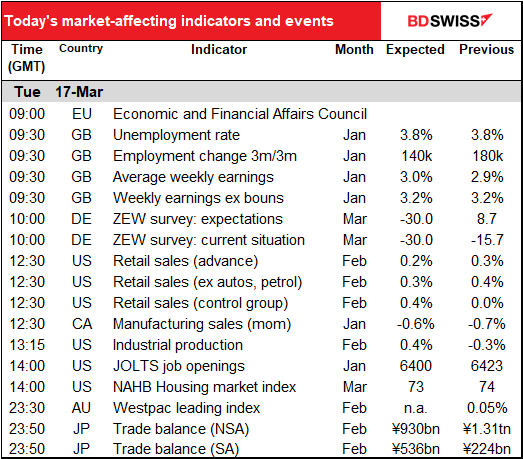
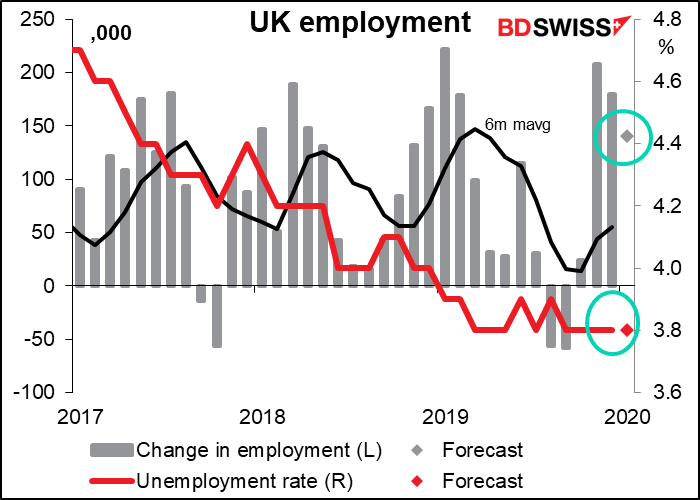
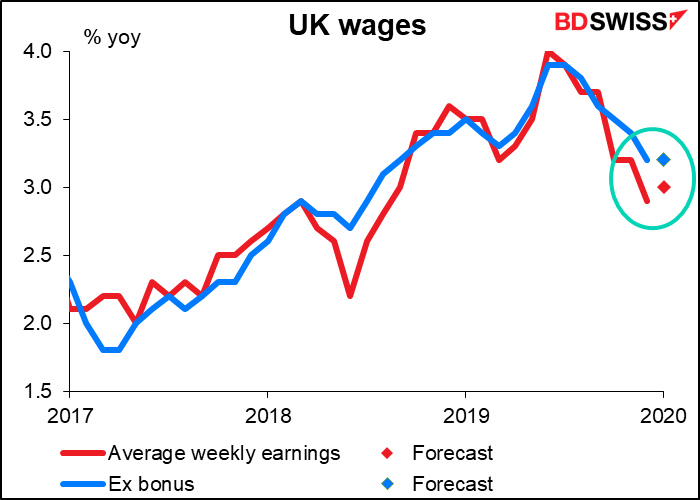
First up today is the UK employment data. The unemployment rate is expected to be unchanged at the recent rate of 3.8%, which is the lowest since 3.7% in December 1974, while the expected change in employment is forecast to be well above trend. At the same time, the change in average earnings is expected to tic up a bit to 3.0% from 2.9%. Overall, the figures are expected to show no change in the excellent UK employment situation ahead of the crisis, which is encouraging – continuing with such good employment conditions could be positive for the pound, assuming that the data isn’t lost among news of virus-related deaths or some new idiotic comment on the UK-EU trade negotiations. That’s a big assumption.
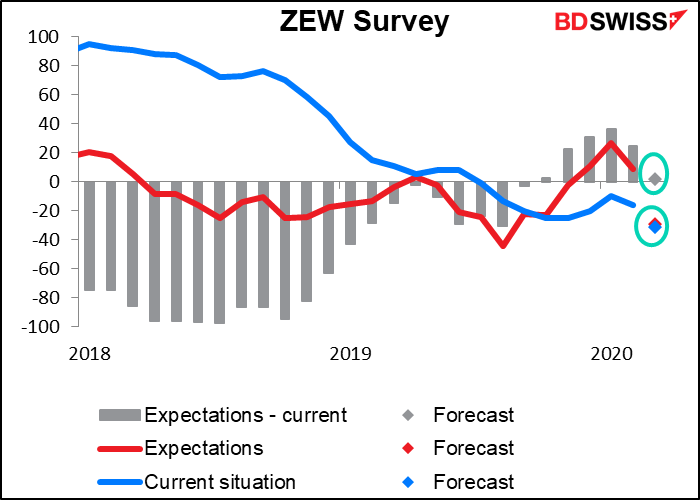
Shortly afterward we get the ZEW survey of analysts and economists. This is expected to show a dramatic shift. Both indices are forecast to fall of course, but what’s striking is how the “expectations” index is expected to flip from slightly positive to just as negative as the expectations index. In other words, the improvement that analysts were expected – measurable by the positive “expectations minus current” figure – has disappeared, meaning people not only think things are bad now, but that they won’t get any better. Pretty grim! Ordinarily this might be negative for the euro, but I don’t think people anywhere else in the Western world are any more optimistic nowadays.
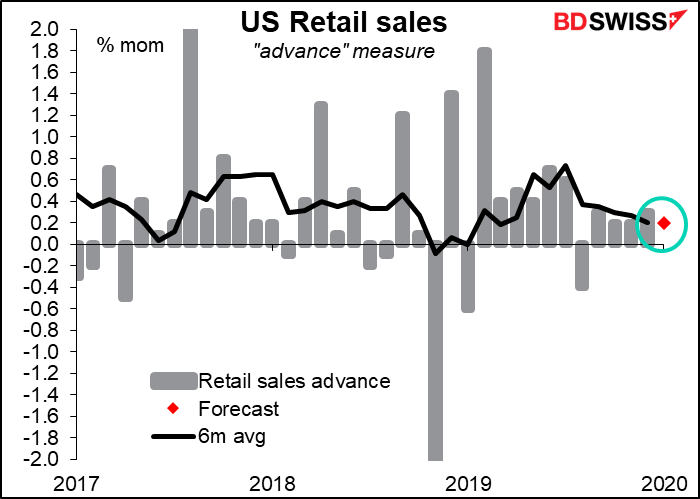
When the US comes in, we get the week’s major US indicator, the widely watched US retail sales. Like yesterday’s disastrous Empire State manufacturing index, this data is relatively up-to-date. The question is, when did people in the US start panic buying toilet paper and hand sanitizer? I suspect that that was March activity, not February. We may therefore see an artificial boost to the March data that would be the harbinger of a collapse in April, much like happens in Japan when they’ve hiked the consumption tax.
The February figure is forecast to be consistent with the recent trend, which could be positive for the dollar. In the not-so-distant past – although it seems like decades ago – the Fed expressed confidence that consumer spending at this level would support the US economy, and a figure like what the market expects would show that indeed that was happening up to the time the virus became an issue. People with disaster on their minds might find that reassuring.
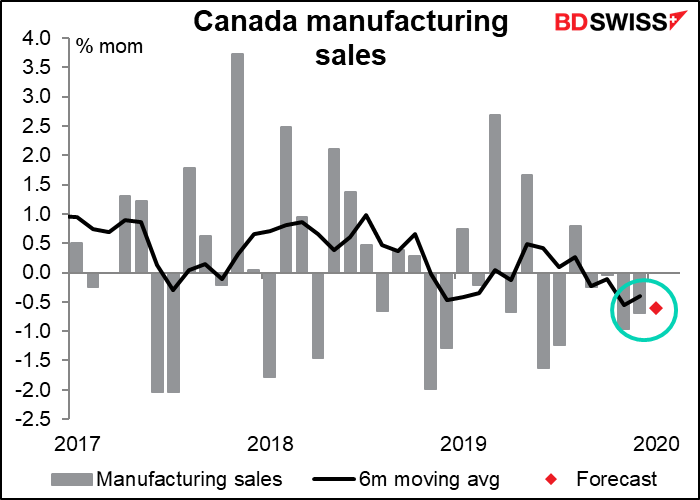
Canadian manufacturing sales are expected to fall from the previous month, the fifth consecutive month when sales are either unchanged or lower. That’s pretty bad. It might get the Bank of Canada worried if they didn’t already have bigger fish to fry, as it were. It’s certainly not good news, and so it’s likely to be negative for CAD.
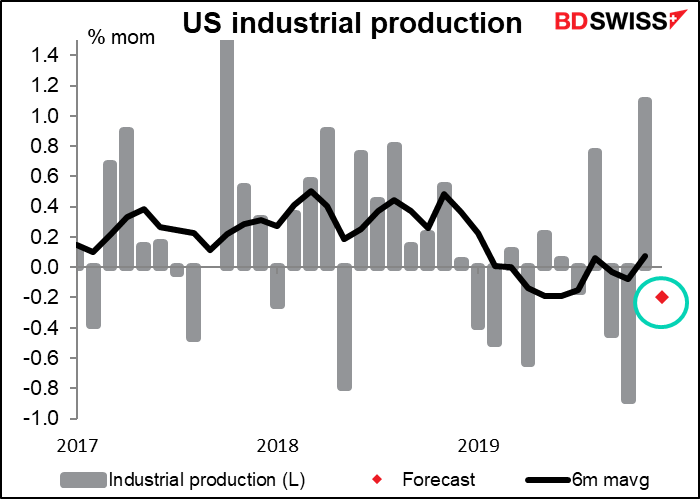
US industrial production seems to be an important indicator for the stock market, but not so important for the FX market. I haven’t found a particularly robust connection between this indicator and subsequent currency moves. USD neutral
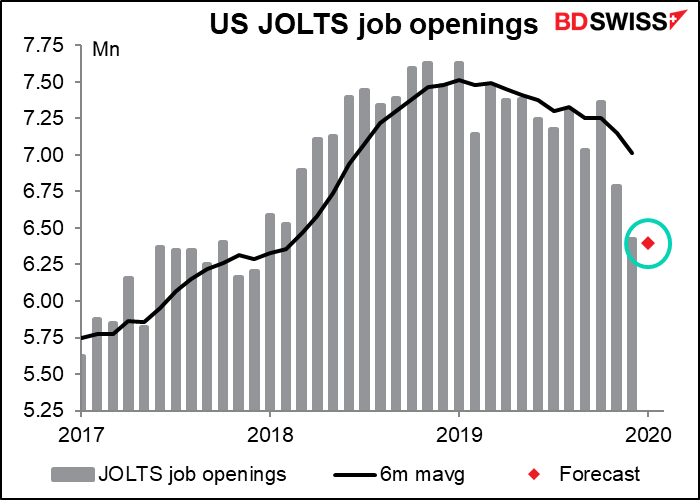
The Job Openings and Labor Turnover Survey (JOLTS) used to be a major indicator under Fed Chair Janet Yellen, who looked at it as an important measure of the strength of the labor market, but since she left we haven’t heard much about it. Economists expect that the number of job openings held pretty steady in January, albeit at a well below-trend level. Keeping steady is pretty good nowadays. USD positive
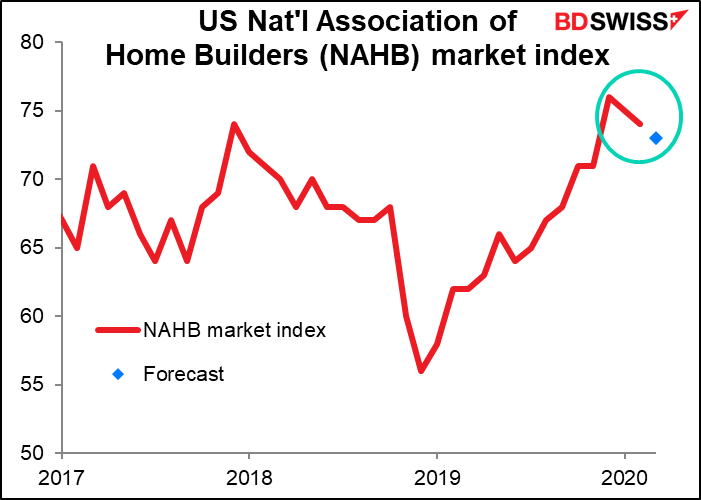
The National Association of Home Builders (NAHB) index is expected to decline one point to 73. Considering that the record for this index, which goes back to 1985, is 78 hit in December 1998, this is still an excellent level – no doubt bolstered by the low level of interest rates. I’d say even down one tic at these levels is positive for the dollar.
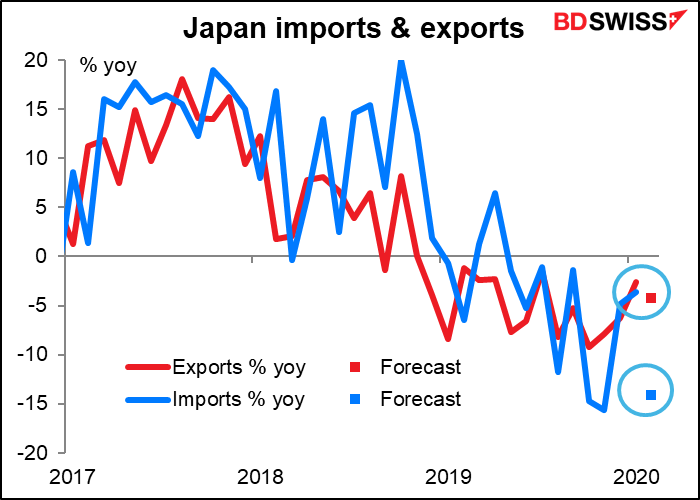
Japan’s trade deficit is forecast to switch to a sizeable surplus on both an adjusted and unadjusted basis.
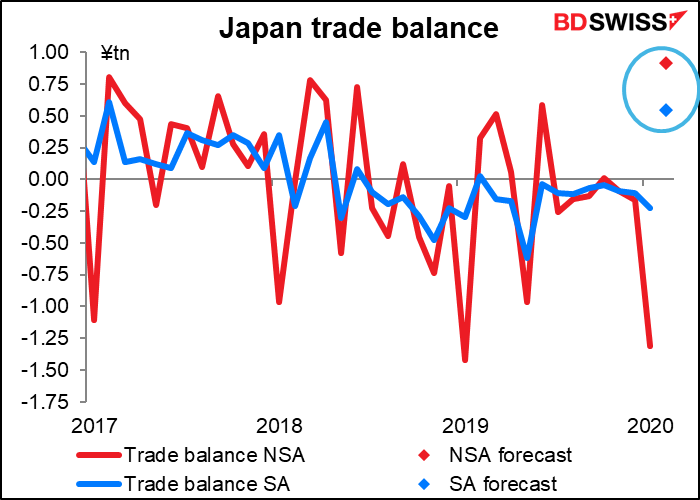
I’m not sure whether that’s good news though because it’s predicated on a collapse in imports, which are forecast to be down 14.0% yoy vs a mere 4.2% yoy fall in exports. A collapse in imports that’s attributable to a slowdown in economic activity isn’t usually good for a currency. However, if it’s due to a fall in oil prices, then it’s good news. In this case it does correspond exactly with the fall in the average price of Brent crude during the month. It could just be that the lower oil price is reducing Japan’s import bill and sending the trade account back into surplus. That would be good for the yen even if demand from China weakens. On the other hand, if it’s because of falling domestic demand, then the market impact may be muted.