Previous Trading Day’s Events (08.04.2024)
______________________________________________________________________
Winners vs Losers
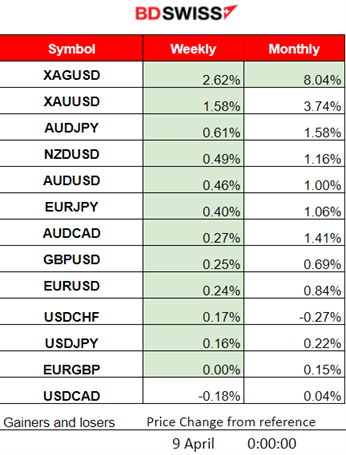
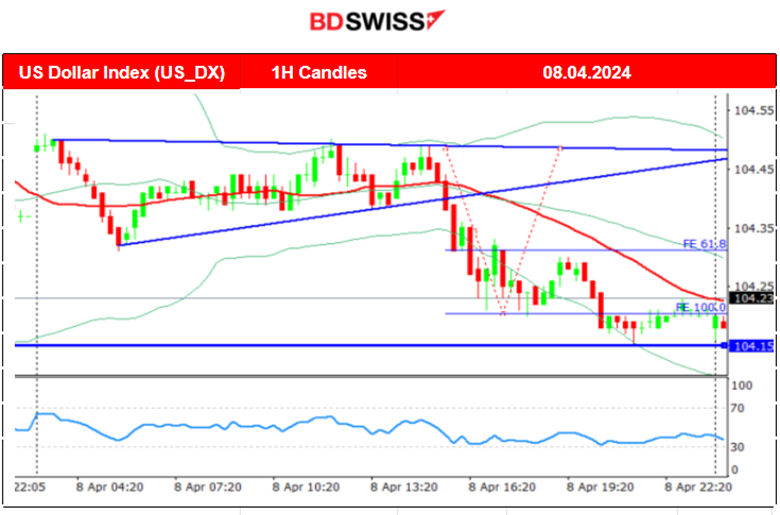
Metals are again on the top of the winner’s list for the week. Silver leads with 2.62% and Gold follows with 1.58%. The dollar weakened yesterday helping gold to reach higher again.
 ______________________________________________________________________
News Reports Monitor – Previous Trading Day (08.04.2024)
Server Time / Timezone EEST (UTC+03:00)
- Midnight – Night Session (Asian)
No important announcements, no special scheduled figures to be released.
- Morning – Day Session (European and N. American Session)
No important announcements, no special scheduled figures to be released.
General Verdict:
 __________________________________________________________________
FOREX MARKETS MONITOR
EURUSD (08.04.2024) 15m Chart Summary
Server Time / Timezone EEST (UTC+03:00)
Price Movement
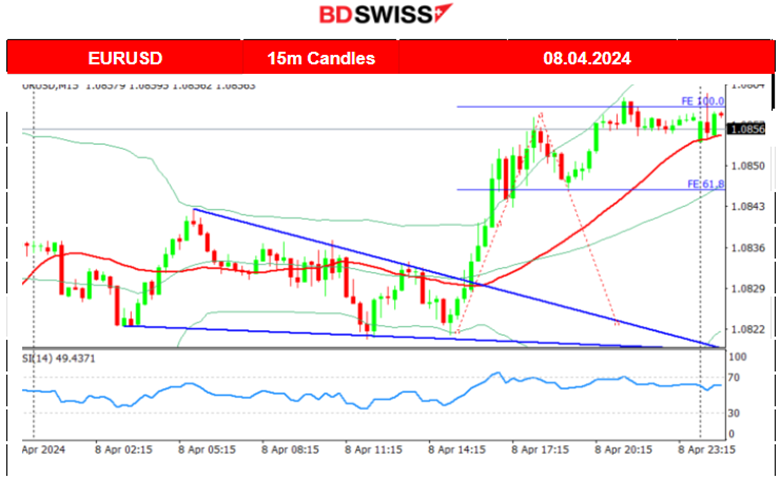
The pair experienced moderate volatility early during the Asian session but the path remained sideways and volatility lowered as the European session started. After the triangle breakout, the pair moved rapidly to the upside as the USD was depreciating. It found resistance near 1.08590 before a short retracement and continued with a sideways movement leaning more to the upside and close to the highs of the day.
 ___________________________________________________________________
CRYPTO MARKETS MONITOR
BTCUSD (Bitcoin) Chart Summary 1H
Server Time / Timezone EEST (UTC+02:00)
Price Movement
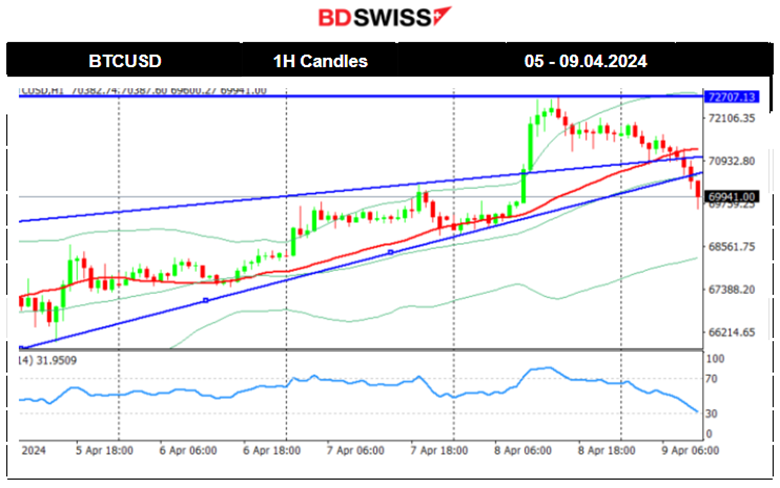
As mentioned in our previous analysis the price of bitcoin was forming an upward wedge that eventually broke to the upside. This caused the price to jump to 72,700 USD resistance level. After that, the price eventually reversed to the downside. It seems that this drop is quite aggressive as it crosses the 30-period MA and stays below it giving a strong signal that the uptrend has stopped and a potential sideways movement or even downward trend is formed soon.
 Crypto sorted by Highest Market Cap:
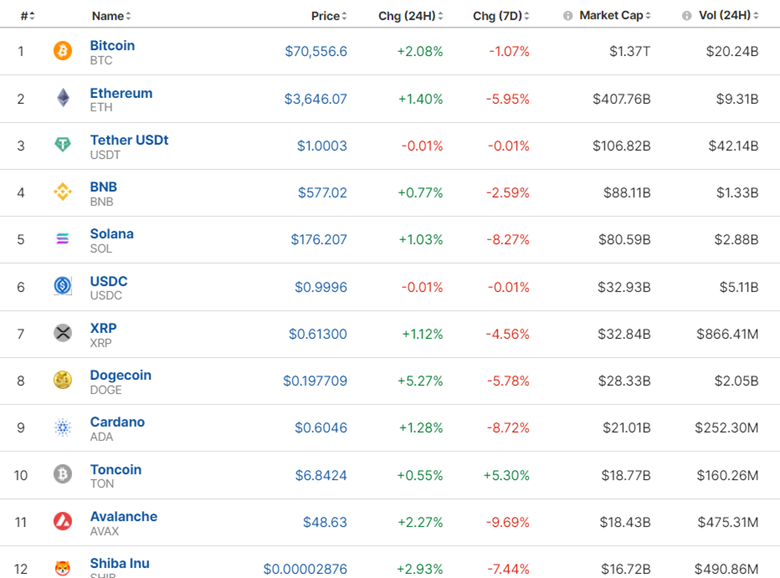
Despite some positive moves recently, the market returns to the downside today, however, gains are still positive for the last 24 hours.
Source: https://www.investing.com/crypto/currencies
______________________________________________________________________
EQUITY MARKETS MONITOR
S&P500 (SPX500) 4-Day Chart Summary
Server Time / Timezone EEST (UTC+03:00)
Price Movement
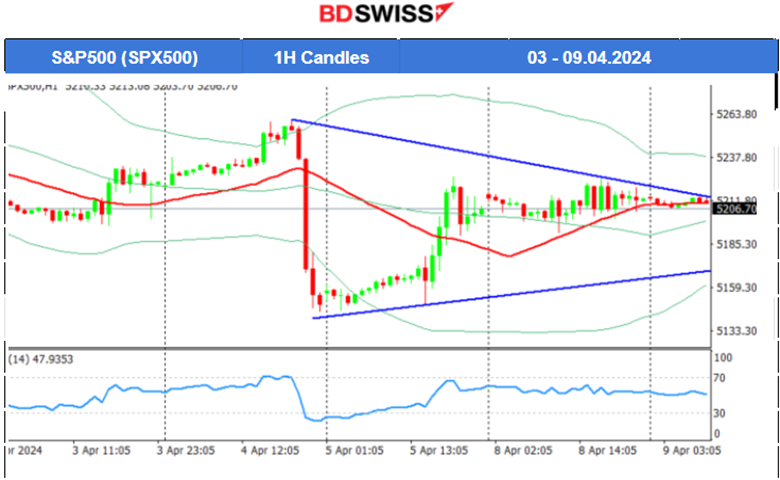
On the 4th of April, the index continued upwards but at some point after 19:00 it experienced a rapid drop. Retracement was quite probable that it would take place as mentioned in our previous analysis. It did not happen immediately but was only completed after the NFP report took place on the 5th of April. The index moved back to the upside crossing the 30-period MA on its way up and eventually remaining close to the MA until the end of the trading day. On the 8th of April, the market saw a sideways movement with volatility levels to be extremely low. This shows that market participants are expecting the inflation report, released on the 10th of April, in order to react greatly.
 ______________________________________________________________________
COMMODITIES MARKETS MONITOR
USOIL (WTI) 4-Day Chart Summary
Server Time / Timezone EEST (UTC+02:00)
Price Movement
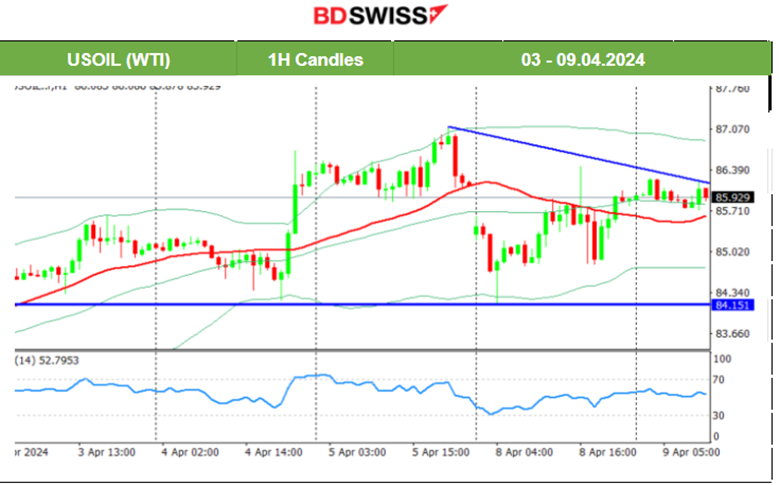
On the 8th of April, the market opened with a gap to the downside and the price tested the support near 84 USD/b before eventually retracing to the intraday mean. This was a huge reversal from the upside causing the price to get below the MA. It might be an indication of an uptrend halt and the start of a new short-term movement to the downside. Middle East tensions eased after Israel withdrew more soldiers from southern Gaza and committed to fresh talks on a potential ceasefire in the six-month conflict.
The level 84.15 USD/b serves as an important support while the 87 USD/b serves as resistance. Volatility levels are lowered and a triangle formation is apparent. Breakout to either direction would potentially lead to a rapid movement to either the mentioned support or resistance level.
 XAUUSD (Gold) 4-Day Chart Summary
Server Time / Timezone EEST (UTC+03:00)
Price Movement
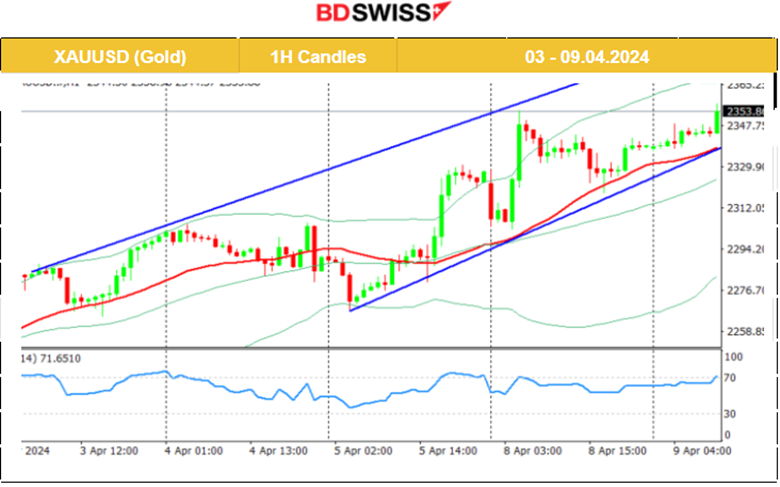
The win-win Gold continues to help bulls perform. After the NFP, it moved significantly higher, the USD depreciation helped, however. While the technical was suggesting an uptrend halt with the price moving below the 30-period MA, it continued with another uptrend, deviating significantly from the MA to the upside. Gold currently remains above the 30-period MA and is on another uptrend amid the U.S. inflation reports taking place this week. 2,350 serves currently as an important resistance level.
 ______________________________________________________________
News Reports Monitor – Today Trading Day (09 April 2024)
Server Time / Timezone EEST (UTC+03:00)

- Midnight – Night Session (Asian)
No important announcements, no special scheduled figures to be released.
- Morning – Day Session (European and N. American Session)
No important announcements, no special scheduled figures to be released.
General Verdict:
______________________________________________________________


