Rates as of 05:00 GMT
Market Recap
The big event yesterday was the US consumer price index (CPI) for September. It proved a bit higher than expected with regards to the month-on-month (mom) change in the headline figure, which is what the market focuses on.

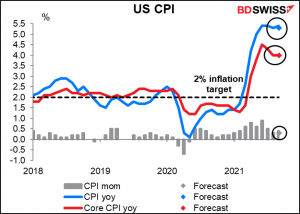
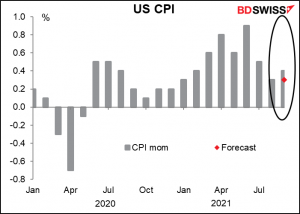
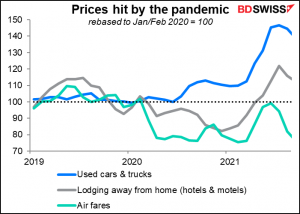
However there were some signs that the factors pushing up inflation recently are moderating. Used cars and trucks, which were responsible for about one-third of the rise in the CPI, fell as did hotel rates and airfares. It may be that prices of things hit by the pandemic are coming back to normal.
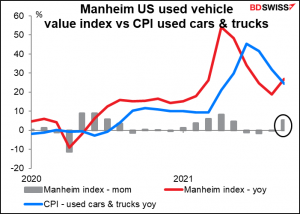
Uh oh…according to Manheim, the world’s largest auto auction house, prices of used cars actually rose 5.3% mom in September, not the 3.7% decline that the CPI said. This suggests we may see used car prices rising again in the CPI in future months.
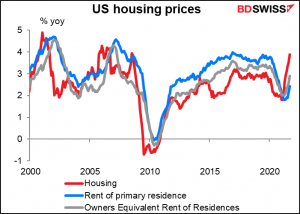
Moreover, there are signs that inflation may be spreading outside of those areas affected by the pandemic. The cost of housing rose by 3.9% yoy, the fastest rate since the housing boom of 2006. Costs like this are more persistent – once you enter into a lease you’re stuck there for a year – and so this would tend to argue against the Fed’s narrative that higher inflation is just “transitory.”
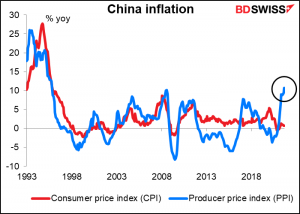
There was some data out overnight to bolster that view. China’s producer price index (PPI) rose at the fastest pace since 1995. China’s PPI is important for the global inflation picture as the country’s exports tend to set the import price level for so many other countries.
We’ll learn more about US prices later today when we get the US producer price index (see below).
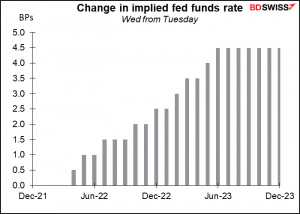
Meanwhile, higher US inflation sparked thoughts that the Fed would have to tighten policy earlier and faster than had been expected. The fed funds futures moved up accordingly.
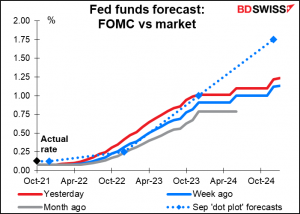
Moreover, the minutes of the September meeting of the rate-setting Federal Open Market Committee (FOMC) confirmed that they are making plans to announce tapering down their $120bn-a-month bond purchases in November. “Participants noted that if a decision to begin tapering purchases occurred at the next meeting, the process of tapering could commence with the monthly purchase calendars beginning in either mid-November or mid-December.”
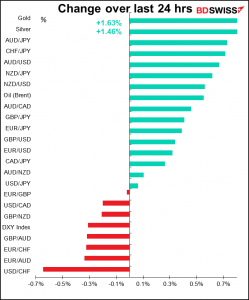
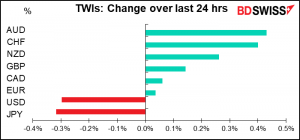
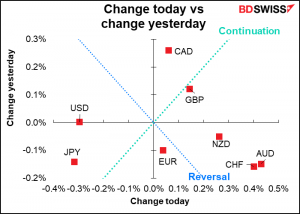
In that case…why did the dollar weaken? I’m not so sure! The only plausible explanations I could find were that a) these developments were largely in line with expectations, the slightly higher mom increase in the headline CPI notwithstanding, or b) the DXY index hit a 12-month high and there may have been some technical selling. Or maybe it was a “risk-on” reaction to a slightly higher S&P 500 (+0.30%) and NASDAQ (+0.73%). It’s a mystery to me. That’s why I expect the dollar to recover today on expectations for higher US interest rates.
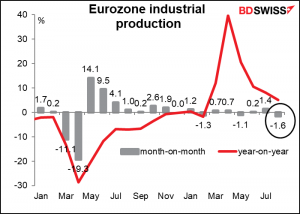
Similarly, EUR didn’t follow what one might’ve expected from a fundamental point of view. EU industrial production fell 1.6% mom instead of -1.7% as expected, with the yoy rate of increase slowing to 5.1% yoy vs 4.7% expected. Yet EUR was also lower.
JPY on the other hand fell as one might expect due to the “monetary policy divergence” theme with the US – in the US they’re moving up the expected date when the Fed might start tightening, but meanwhile it’s generally expected that the Bank of Japan will keep rates steady until Godzilla returns to finish smashing Tokyo.
But…one might say the same for the Swiss National Bank (SNB), which has kept its interest rates at the lowest level in human history since 2015. So why did other safe-haven currency, CHF, gain so much? Especially in line with the risk-sensitive AUD? That could be due in part to a Deutsche Bank report that says CHF could be a good hedge in an inflationary environment as the SNB might tolerate a stronger CHF as a defence against importing inflation, according to Bloomberg.
I happen to think CHF is wildly expensive on a purchasing-power-parity basis and so buying CHF is like buying an overvalued stock, but as we’ve seen with Tesla, fundamental valuations don’t mean much nowadays.
GBP too ignored much weaker-than-expected GDP (+0.1% mom vs +0.4% expected), a widening trade deficit, and an impending crisis over the Irish border to move higher.
Today’s market
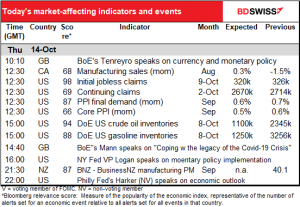
Note: The table above is updated before publication with the latest consensus forecasts. However, the text & charts are prepared ahead of time. Therefore there can be discrepancies between the forecasts given in the table above and in the text & charts.
Pretty quiet in the morning in Europe. The day really starts when the US comes in and we get the dreaded weekly US jobless claims.
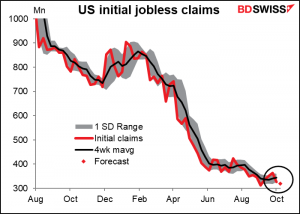
Initial claims seem to have bottomed out, but that’s not the same as improving. Although last week was much better than expected – down 36k, the most in three months, instead of -14k as expected – still they were higher than they were a month ago (326k vs 312k). This week they’re expected to fall a measly 6k to 320k, which would leave them above the Sep. 3rd level yet again. They’re still about 100k a week or around 50% higher than they were before the pandemic began (212k average Jan/Feb 2020). In other words, they still show signs of a lot of stress in the labor market.
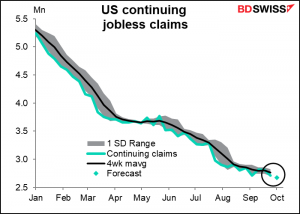
Continuing claims are expected to fall by 44k. That would be more or less in line with the average of -35k a week over the last month. Continuing claims are coming down more successfully than initial claims, but that may just represent people’s benefits expiring.
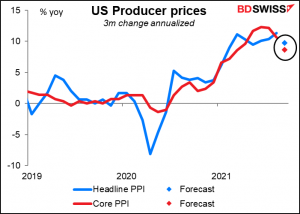
The US producer price index (PPI) is expected to show prices rising at an even faster pace. That’s not surprising given the surge in energy cost and other commodities.
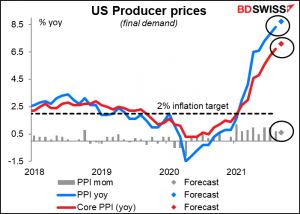
However, let’s not forget base effects that can distort the yoy rate of change. Taking the three-month rate of change and annualizing it, it seems that prices are rising at a slower pace than before. They’re certainly not falling, but this statistic too adds credibility to the “transitory” thesis. Will anyone care? Will anyone even notice? Probably not. The market is convinced that inflation is heading higher and “confirmation bias” will probably filter out any information that doesn’t agree with this ascendant narrative.
