

Previous Trading Day’s Events (20.06.2024)
“The underlying inflationary pressure has decreased again compared to the previous quarter,” SNB Chairman Thomas Jordan said. “With today’s lowering of the SNB policy rate, we are able to maintain appropriate monetary conditions.”
Various factors lie behind Switzerland’s low price pressures, including an energy mix that makes the country less exposed to oil and gas costs, wage restraint, and protection against imported price inflation from the strong franc.
Cooling inflation allowed the SNB to become the first major central bank to lower rates at its last meeting.
British inflation fell to 2% in May as per the CPI data report this week, hitting the BoE’s target for the first time since 2021, but policymakers remain concerned about underlying price pressures, including strong price growth in the services sector.
______________________________________________________________________
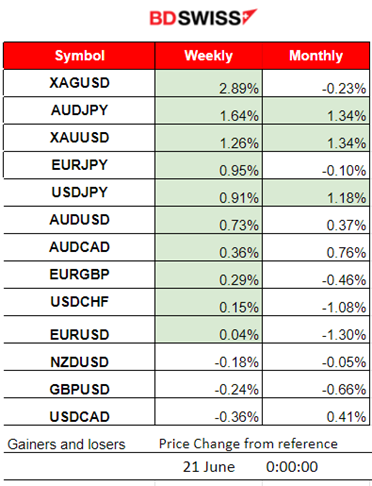
Winners vs Losers
Silver leads this week with 2.89% gains. Metals moved further upwards. The dollar experienced appreciation with most pairs (USD as quoted) reaching the bottom for this week. AUDJPY and Gold lead for this month so far with 1.34% performance each.
 ______________________________________________________________________
News Reports Monitor – Previous Trading Day (20.06.2024)
Server Time / Timezone EEST (UTC+03:00)
- Midnight – Night Session (Asian)
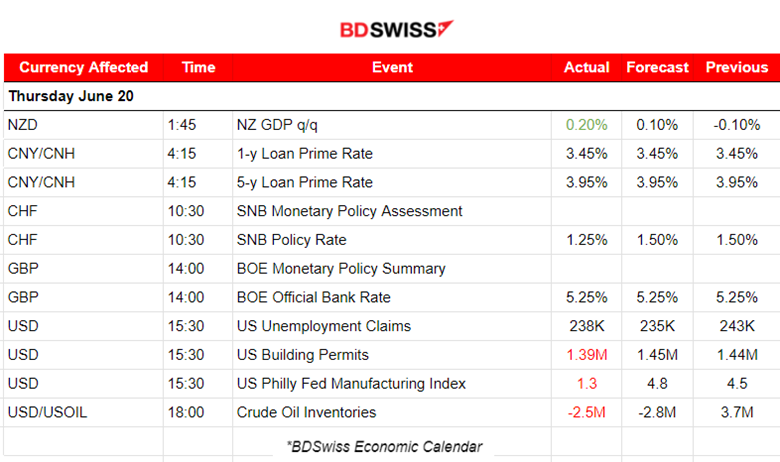
At 1:45, the New Zealand dollar saw a surprisingly strong appreciation against the U.S. dollar, driven by stronger-than-expected GDP data for the first quarter. New Zealand’s economy grew by 0.2% quarter-on-quarter in Q1, up from 0% in the previous quarter, surpassing expectations. A retracement took place soon after the release and it ended up as a full reversal to the intraday MA.
- Morning – Day Session (European and N. American Session)
The SNB announced their decision to cut rates, surprising the market and bringing the policy rate down to 1.25% from 1.50%. The market reacted with CHF depreciation at the time of the release. USDCHF jumped nearly 70 pips and remained high.
The BOE announced their decision to not cut rates meeting the expectations of no change in interest rate policy. The market reacted with GBP depreciation. GBPUSD initially moved to the downside for about 25 pips, reaching the support at near 1.26865, where it stalled, but later continued the downside path.
The U.S. unemployment claims were reported lower, falling by 5K to 238K signalling a weaker labour market even though the expectations of a lower figure. No major impact was recorded in the market at that time.
General Verdict:
 __________________________________________________________________
FOREX MARKETS MONITOR
EURUSD (20.06.2024) 15m Chart Summary
Server Time / Timezone EEST (UTC+03:00)
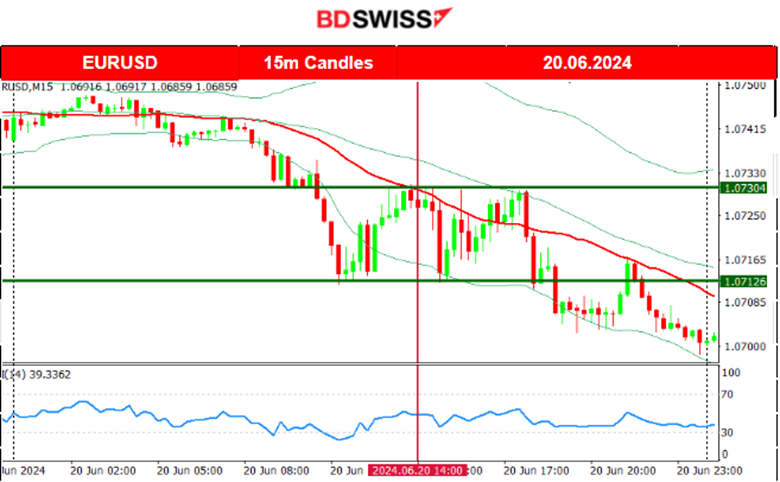
Price Movement
The pair started to move significantly to the downside after the start of the European session as the USD was experiencing unusual early volatility and was appreciating greatly. The pair found support at near 1.07125 and retraced eventually to the 30-period MA. The jobless claims news at 15:30 did not affect the USD greatly. EURUSD continued with a sideways volatile path and eventually broke that intraday support, moving lower steadily until the end of the trading day.
 USDCHF (20.06.2024) 15m Chart Summary
Server Time / Timezone EEST (UTC+03:00)
Price Movement
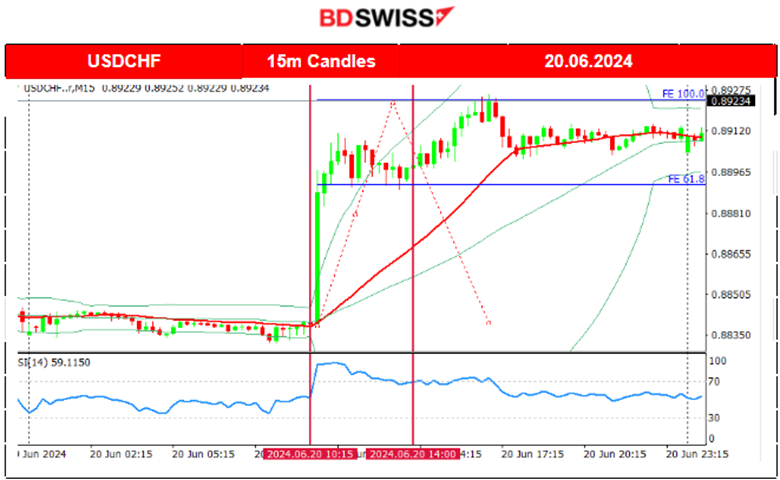
The pair was moving with low volatility sideways, around the 30-period MA until the interest rate decision announcement from the SNB. At the time of the figure release the CHF depreciated greatly since the SNB decided to surprise the markets with another cut of 25 basis points bringing the policy rate down to 1.25%. It stated: “The SNB is also willing to be active in the foreign exchange market as necessary. The underlying inflationary pressure has decreased again compared to the previous quarter. With today’s lowering of the SNB policy rate, the SNB is able to maintain appropriate monetary conditions.” The USDCHF jumped and reached more than 90 pips intraday until it found resistance. It remained high without any important retracement taking place as the USD was also strengthening yesterday.
 GBPUSD (20.06.2024) 15m Chart Summary
Server Time / Timezone EEST (UTC+03:00)
Price Movement
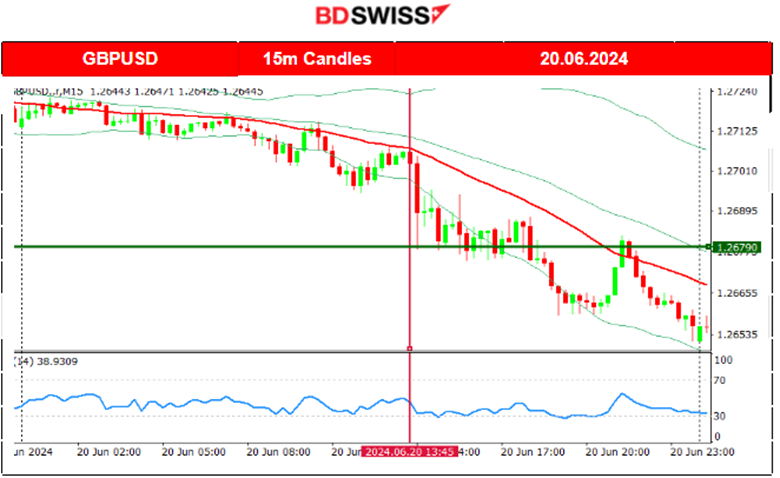
The pair moved steadily downwards overall. The BOE decided to keep rates steady and elevated but that was bypassed by the market that reacted with GBP depreciation. The pair dropped near 25 pips at the time of the release. GBPUSD moved eventually lower steadily below the 30-period MA on a downward intraday trend with the help of USD’s steady strengthening during the trading day.
 ___________________________________________________________________
CRYPTO MARKETS MONITOR
BTCUSD (Bitcoin) Chart Summary 1H
Server Time / Timezone EEST (UTC+03:00)
Price Movement
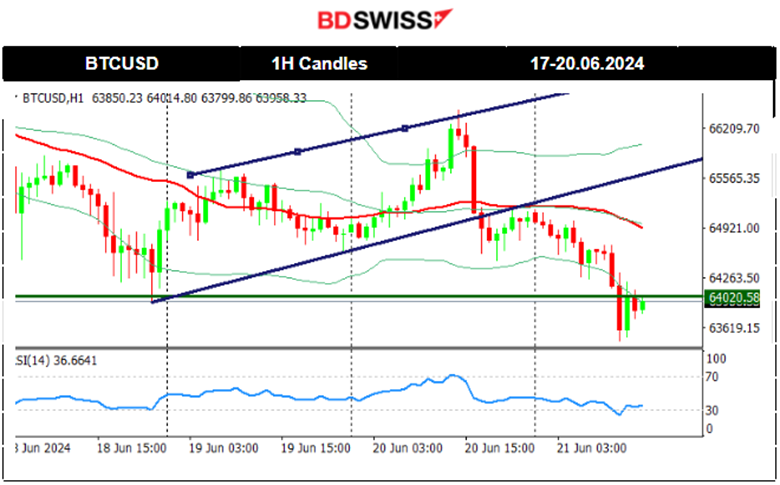
When the weekend passed, on the 17th, the market started to get active again and volatility labels rose. The price fell to 65K before reversing to the upside quite rapidly finding resistance close to 67,200 USD before retracing to the intraday mean. On the 17th, the price saw a fall reaching a support near 64,500 USD before it finally retraced to the 30-period MA. On the 18th, the price broke, and that support moved lower until it reached the next support at near 64K USD. Retarcement back to the 30-period MA followed soon indicating that the 65.5 USD acts as the important weekly mean. On the 20th the price moved to the upside breaking the upper band of a triangle formation and stalled at 65,500 USD. That changed on the 21st when the price moved lower quite aggressively reaching the support at 63,430 USD before retracing and settling to 64K USD.
 Crypto sorted by Highest Market Cap:
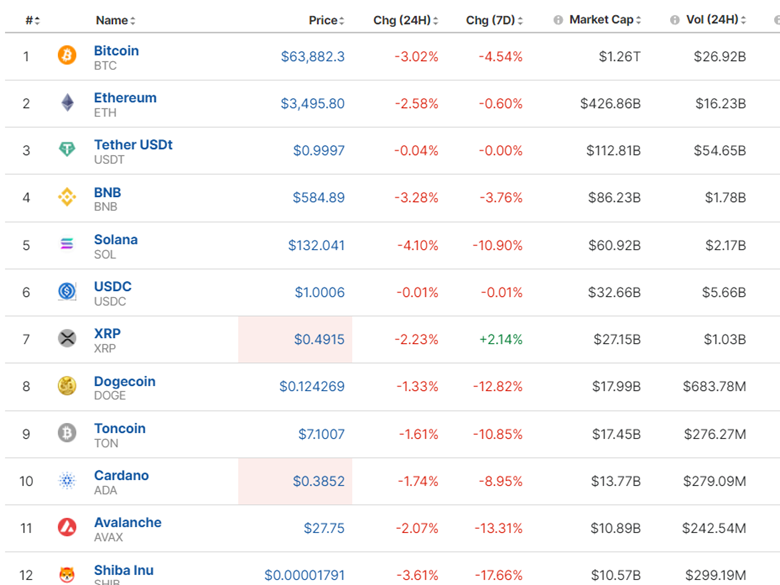
Crypto Market is still suffering. We do not see any significant improvement for days. Bitcoin keeps on dropping and breaking important support levels. It is settled now at 64K USD. In June we had a peak around 72K USD.
https://www.investing.com/crypto/currencies
______________________________________________________________________
EQUITY MARKETS MONITOR
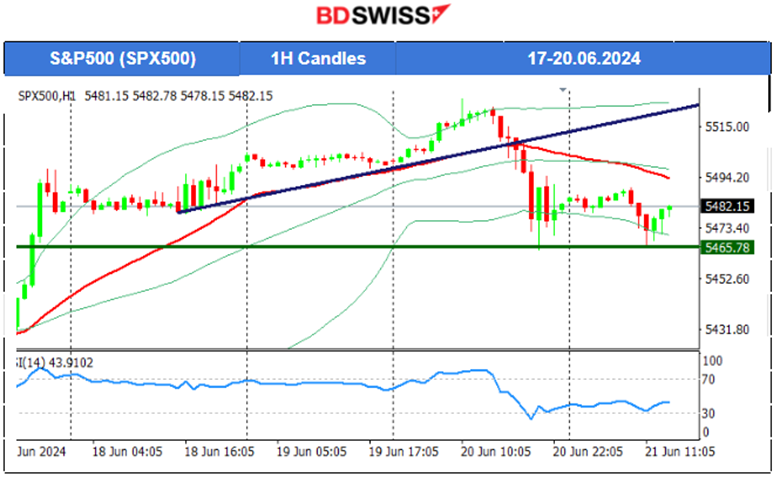
S&P500 (SPX500) 4-Day Chart Summary
Server Time / Timezone EEST (UTC+03:00)
Price Movement
A triangle formation was broken to the downside on the 14th of June and support near 5,400 USD was reached as mentioned in our previous analysis. The index reversed fully after that and it moved slightly above 5,440 USD, above what looks like to be a channel now. The level 5,445 USD acted as a resistance and it was broken on the 17th. The index jumped to the next resistance at near 5,500 USD before a slowdown. Retracement did not take place since 5,479-5,480 USD was not broken. Instead, it acted as a strong support that caused the index to bounce and move to the upside. After a slow trading day for index futures and a U.S. holiday, the market opened on the 20th higher, breaking the resistance with momentum to the upside, being part of an upward wedge formation. On the 20th, the wedge was broken to the downside and the index dropped rapidly to the support near 5,456 USD. Retracement followed.
 ______________________________________________________________________
COMMODITIES MARKETS MONITOR
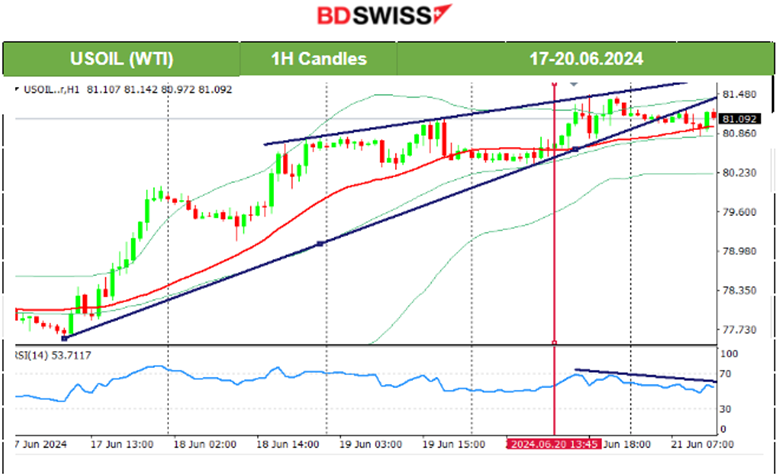
USOIL (WTI) 4-Day Chart Summary
Server Time / Timezone EEST (UTC+03:00)
Price Movement
The price of Crude oil was in a consolidation phase after a long uptrend. On the 17th the price moved above the 79 USD/b resistance and succeeded in a breakout of the upside, moving quite rapidly and reaching the next resistance at near 80 USD/b. Retracement took place on the 18th with the price returning to the 79.10 USD, 61.8 Fibo retracement level. However, on the same day, it turned to the upside, broke the 80 USD/b level and moved further upwards. Crude oil is breaking May’s resistance levels but stalled on the 81 USD/b level. On the daily chart, it is apparent that crude was on a reversal, crossing the 30-period MA on its way up. That uptrend took too long though as fundamentals were pushing the price higher and higher. The price eventually broke the 81 USD/b level on the 20th and it remains high for now above the 30-period MA.
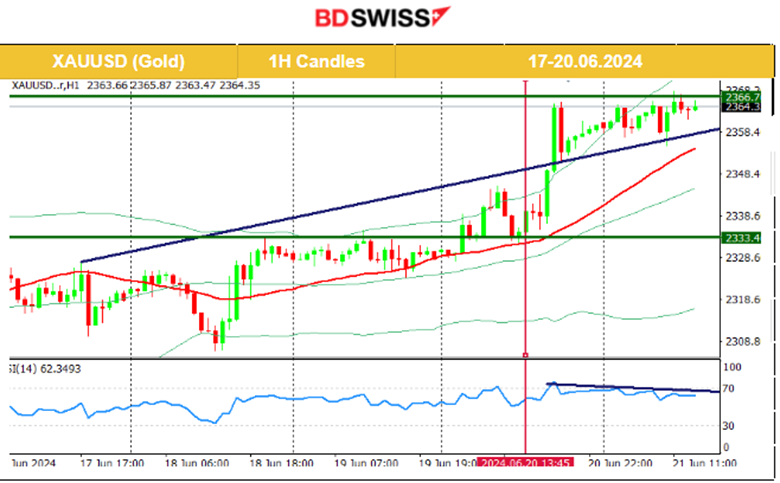
 XAUUSD (Gold) 4-Day Chart Summary
Server Time / Timezone EEST (UTC+03:00)
Price Movement
On the 14th of June, the price reversed to the upside and tested the resistance again, at near 2,340 USD/oz unsuccessfully. It reversed back to the 30-period MA and remained on a consolidation path with the mean price at near 2,320 USD/oz. A triangle was formed as volatility levels lowered and on the 18th of June, that triangle was broken to the downside. However, instead of the price moving lower, the weak U.S. retail sales figures caused USD depreciation on the 18th pushing gold to the upside. Another triangle formation was visible as it found resistance. The resistance broke on the 20th of June with Metals in general experiencing a rise in prices despite the dollar strengthening. The 2,350 USD/oz was reached as per our previous analysis with gold not losing momentum and reaching even higher at near 2,365 USD/oz on the 20th. A triangle formation is now visible with the RSI showing showing bearish signals.
 _____________________________________________________________
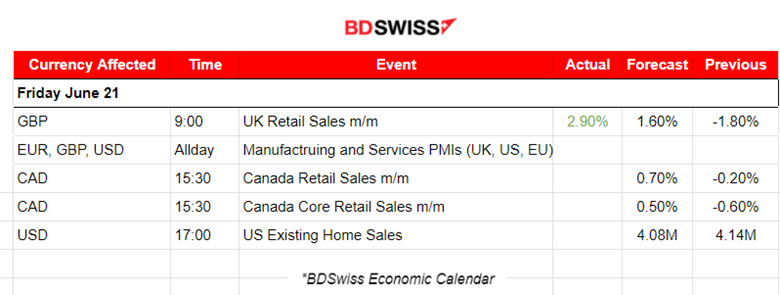
News Reports Monitor – Today Trading Day (21.06.2024)
Server Time / Timezone EEST (UTC+03:00)
- Midnight – Night Session (Asian)
No significant news announcements. No scheduled important releases.
- Morning – Day Session (European and N. American Session)
The growth in retail sales was reported positive at 11:30 and the market reacted with GBP depreciation initially. GBPUSD fell by 10 pips but the effect reversed soon though and eventually GBPUSD moved to the upside staying close to the mean and settling sideways.
Canada’s retail sales will be reported as well at 15:30 and the forecast in regards to the figures is optimistic as well. Analysts expect growth despite a reduction in interest rates and a recent elevated jobless rate announcement. The employment change was also reported lower. CAD pairs are expected to be affected heavily during the time of the release. A miss, with lower than expected growth could lead to CAD depreciation.
General Verdict:
______________________________________________________________


