

Previous Trading Day’s Events (10 Jan 2024)
Source:https://www.reuters.com/technology/why-us-bitcoin-etf-is-game-changer-crypto-2024-01-10/
______________________________________________________________________
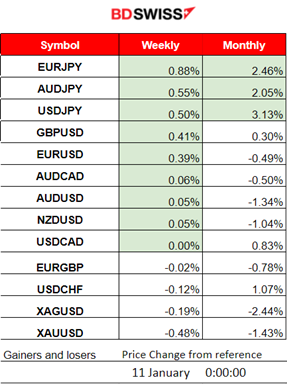
Winners vs Losers
The USD corrected to the downside from yesterday’s positive performance and the JPY significantly depreciated. These factors caused the JPY pairs (JPY as Quote) to remain high with EURJPY to lead with 0.88% gains this week and USDJPY to be on the top for this month with just over 3% gains so far.
 ______________________________________________________________________
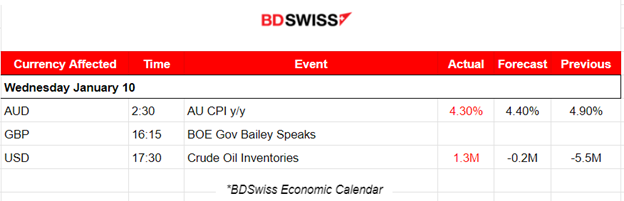
News Reports Monitor – Previous Trading Day (10 Jan 2024)
Server Time / Timezone EEST (UTC+02:00)
- Midnight – Night Session (Asian)
Inflation in Australia is lowering significantly. The core inflation also eased sharply reinforcing market expectations that interest rate hikes are no longer needed. The AUD was affected at that time negatively with sudden but no strong depreciation that soon faded. No major impact here.
- Morning–Day Session (European and N. American Session)
Bank of England (BOE) Governor Andrew Bailey highlighted once more that BOE is determined to return U.K. inflation to target. He highlighted the fact that labour market conditions in the U.K. remained stable and that household income rose in recent months contributing to further mitigation of elevated interest rate effects. The UK inflation rate is the highest amongst all G7 nations, last recorded at 3.9%.
General Verdict:
 ____________________________________________________________________
FOREX MARKETS MONITOR
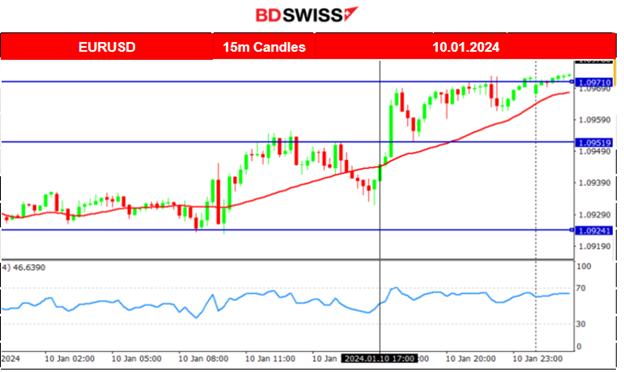
EURUSD (10.01.2024) 15m Chart Summary
Server Time / Timezone EEST (UTC+02:00)
Price Movement
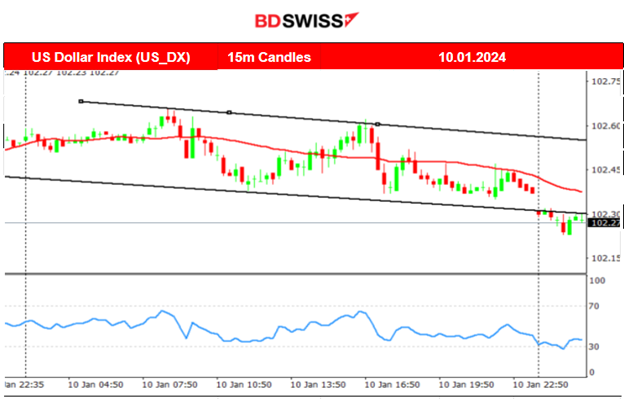
As the USD was losing strength yesterday most USD pairs closed higher (USD as Quote). The EURUSD moved significantly to the upside since the start of the European session finding resistance first at 1.09515 before retracing to the 30-period MA. It bounced back to the upside after that after the start of the N. American session reached 1.09710 and closed eventually higher for the day, with the USD obviously signalling to be the main driver of the pair’s path.
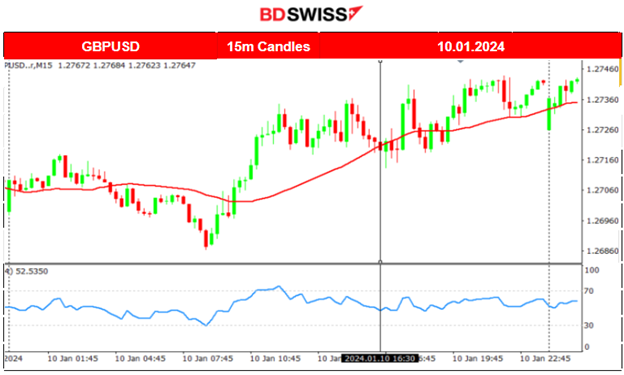
GBPUSD (10.01.2024) 15m Chart Summary
Server Time / Timezone EEST (UTC+02:00)
Price Movement
A quite volatile trading day for the GBPUSD. The pair moved early to the upside quite aggressively reaching a resistance at 1.27350 before a retracement to the downside. The pair moved steadily towards the 30-period MA and remained close to the mean until the speech. At the time of the BOE’s Governor Andrew Bailey’s statements after 16:15, the pair moved to the upside, as the dollar depreciated moderately against the GBP at the time, a non-significant impact on the GBP that soon faded. Volatility levels lowered and the pair moved sideways while being close to the mean (MA).
 ___________________________________________________________________
CRYPTO MARKETS MONITOR
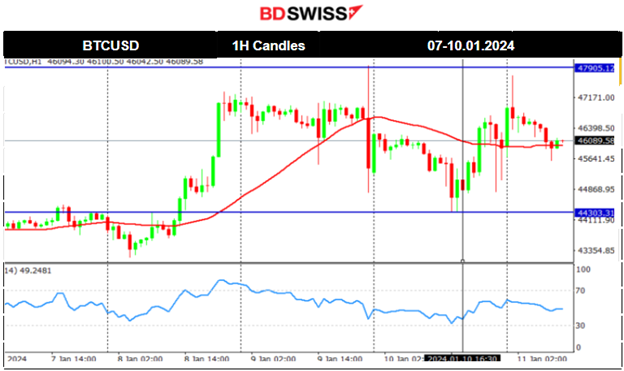
BTCUSD (Bitcoin) 4-Day Chart Summary
Server Time / Timezone EEST (UTC+02:00)
Price Movement
Bitcoin jumped yesterday ahead of the spot exchange-traded funds (ETF) approval deadline for the 10th Jan, reaching 47300 USD before retracing to the 61.8 Fibo level. The growing anticipation of imminent approvals of spot Bitcoin ETF was the main driver to the upside. A post sent from the Securities and Exchange Commission (SEC) account on the social platform X/Twitter announced the approval of a long-awaited Bitcoin exchange-traded fund causing a shock in the market and a jump in Bitcoin’s price reaching near to 48K USD. It did not last long though since the SEC said soon after that the post was “unauthorised”, and that the agency’s account had been “compromised”. This announcement caused Bitcoin to fall again dramatically the same day and settle near 46K USD eventually. Yesterday Bitcoin fell even lower reaching the support at near 44300 USD before reversing, returning back to the MA just before the SEC announcement for approval. U.S. regulators approved Bitcoin ETFs, dramatically broadening access to the 15-year-old cryptocurrency and its price experienced an intraday shock with high volatility. The price eventually settled near 46K as volatility calmed.
Sources:
Crypto sorted by Highest Market Cap:
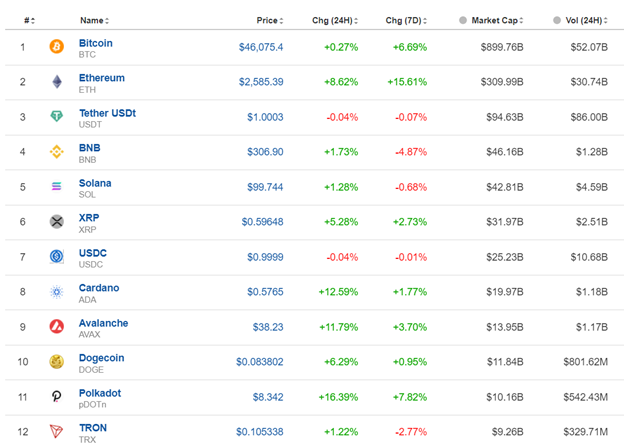
Cryptos now show gains as they recover significantly from yesterday’s low levels. Prices remained low as many investors liquidated their positions after the false report announcement for ETF approval the same day. This changed as the approval deadline was approaching causing their value to rise and remain high as the approval eventually took place.
Source: https://www.investing.com/crypto/currencies
______________________________________________________________________
EQUITY MARKETS MONITOR
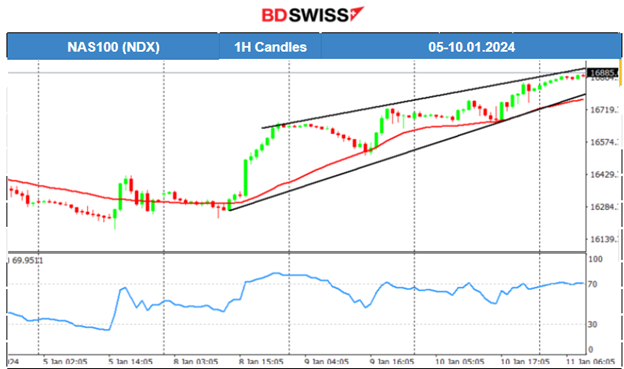
NAS100 (NDX) 4Hour Timeframe Chart Summary
Server Time / Timezone EEST (UTC+02:00)
Price Movement
Clearly, the downtrend was interrupted during the NFP report as the index (and the other U.S. benchmark indices) moved to the upside significantly crossing the 30-period MA on the way up and resulting in a rather sideways path after the volatility levels started to fall. A triangle formation formed after the news and the index was signalling that there might be a breakout to the downside. The support however proved to be strong enough. The index ( and all the other benchmark indices) experienced a surprisingly upward and rapid movement upon NYSE opening on the 8th Jan. The index reached the resistance at near 16600 USD before retracement took place. It eventually completed the retracement to the 61.8 Fibo level, as mentioned in our previous analysis, on the 9th Jan, reaching near 16500 USD before bouncing again to the upside reaching 16720 USD. On the 10th Jan the index touched the MA and bounced again to the upside remarkably continuing with the uptrend. Same path for the other benchmark indices as well.
 ______________________________________________________________________
COMMODITIES MARKETS MONITOR
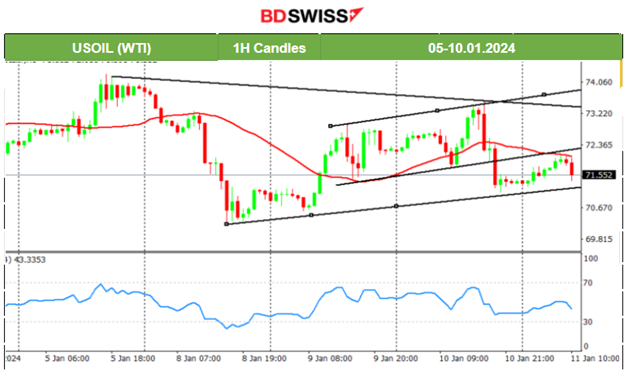
USOIL (WTI) 4-Day Chart Summary
Server Time / Timezone EEST (UTC+02:00)
Price Movement
Crude Oil moves with high volatility around the 30-period MA in general. On the 8th Jan, the price experienced a downward movement crossing the 30-period MA, a reversal to the downside. The price moved fast and reached the support near 70 USD/b before eventually retracing to the 61.8 Fibo level. The path changed and Crude moved sideways. Volatility levels started to drop for some period of time and the price formed a triangle with resistance being close to 73 USD/b. Crude tested that several times without success but on the 10th Jan it finally broke the resistance reaching 73.5 USD/b before rapidly reversing back and crossing the MA towards the way down to the support 71 USD/b. Retracement followed with the price returning back to the mean again. These volatile movements form a larger triangle and the breakout of a barrier could cause a rapid and long movement to one direction, deviating a lot from the current mean.
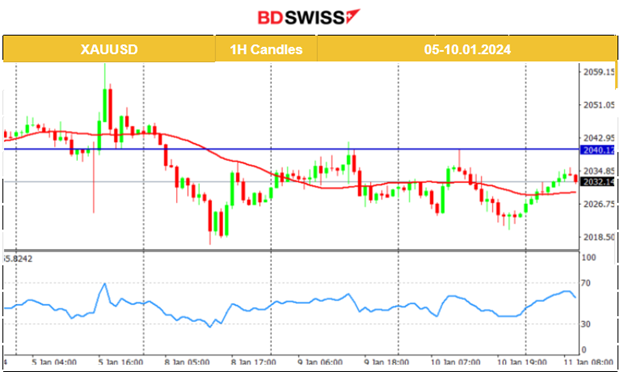
XAUUSD (Gold) 4-Day Chart Summary
Server Time / Timezone EEST (UTC+02:00)
Price Movement
Volatility levels remain moderate but still higher than typical. 2040 USD/oz is the next resistance level upon successful breakout and the 2049 USD/oz is the next. These long reversals, like the one from yesterday’s fall, show uncertainty and we see only a sideways path for now with support and resistance breakouts being the only tools we have for creating a new view of the price future path, in combination with the USD effects. Gold’s price is expected to be affected greatly at 15:30, during the U.S. inflation news.
 ______________________________________________________________
News Reports Monitor – Today Trading Day (11 Jan 2024)
Server Time / Timezone EEST (UTC+02:00)
- Midnight – Night Session (Asian)
No important news announcements, no special scheduled releases.
- Morning–Day Session (European and N. American Session)
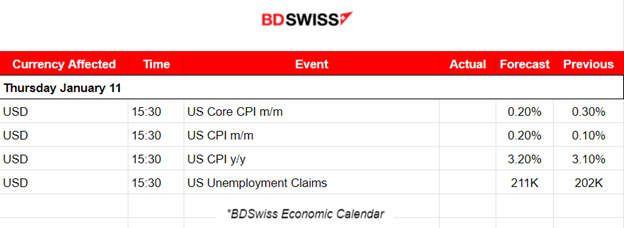
The long-awaited inflation-related data for the U.S. are going to be released at 15:30. What the market has seen so far in regards to higher interest rate effects is that for some time inflation has lowered significantly and the labour market has remained relatively stable. The U.S. is apparently a 3% to 4% inflation economy for now.
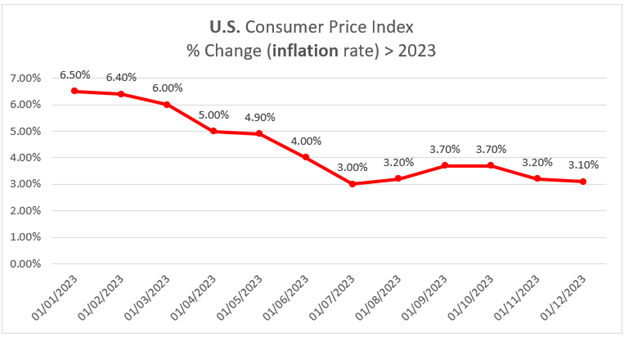
However, it’s still nowhere near 2%. The yearly inflation figure is actually expected to be reported higher with an anticipated rise in the non-core monthly CPI change. With still hot labour market data being released this could be the case, however, the monthly figures, due to season factors, might be way lower than the true figures instead, or at least the same. In any case, the USD could see more strength before any rate cuts come close.
General Verdict:
______________________________________________________________


