Rates as 05:30 GMT

Market Recap
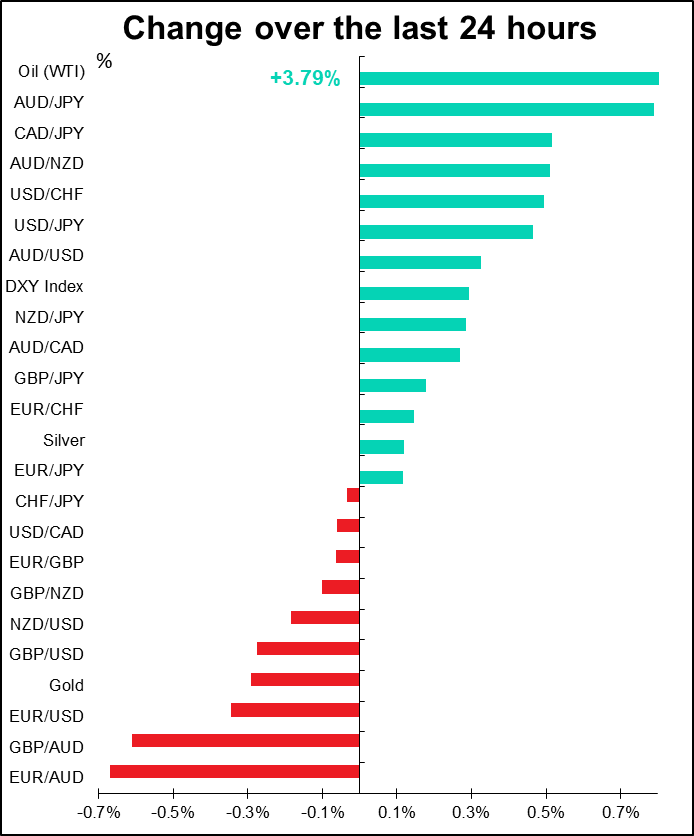
It’s either “Day A” or “Day B” nowadays. “Day A” is “risk-on,” “Day B” is “risk-off.” Wednesday and this morning were definitely “Day A” again, like Tuesday. US stocks up, (almost) all Asian stock markets up, and you can probably guess the movement of the FX market accordingly; AUD up, JPY and CHF down.
Yesterday morning I mentioned how surprising it was that oil was down despite the “risk on” sentiment. It caught up during the day with a respectable 3.8% gain.
Gold was down but silver up – usually (but clearly not always) not always the two move in the same direction – around 19% of the time over the last two years they’ve moved in opposite directions.
One reason given for the rebound in sentiment was a Chinese TV report that a research team at a university in China has found an effective drug to treat people with the coronavirus. However, the World Health Organization (WHO) issued a denial, saying there was no such drug.
If you’re interested in tracking the virus, Johns Hopkins University has a great site with a map of the outbreak and much data. You can see it here.:
The WHO has its own coronavirus pages. They also have a daily situation report. The situation report has a rather discouraging graph showing cases of the virus identified outside of China. Note that the graph had been trending down but suddenly jumps up again. (There was another graph that did not show the same jump in the last two days, but that graph seems to be less complete than this one.)

Jim Bianco’s research includes the following graph, which shows how the mortality rate of the coronavirus (red line) has blown past that of the SARS (blue line) and swine flu (yellow line) epidemics. You can follow him on Twitter (@biancoresearch).

What we want to see from these statistics is reassurance that a) the number of new cases outside of China is peaking, especially cases where the virus was acquired locally; and b) the rate at which the virus is spreading outside of Wuhan province is peaking. That would give us some assurance that the virus is coming under control.
However, let me say that we don’t actually know for sure how many people have been infected and what the mortality rate is. Remember, these are Chinese statistics, and the Chinese government is not always 100% transparent with its statistics. A Taiwanese website said that Tencent, a Chinese internet company, may have inadvertedly (or maybe on purpose!) leaked the “real” figures, which is says were “astronomically higher than official figures.”
On late Saturday evening (Feb. 1), Tencent, on its webpage titled “Epidemic Situation Tracker,” showed confirmed cases of novel coronavirus (2019nCoV) in China as standing at 154,023, 10 times the official figure at the time. It listed the number of suspected cases as 79,808, four times the official figure.
The number of cured cases was only 269, well below the official number that day of 300. Most ominously, the death toll listed was 24,589, vastly higher than the 300 officially listed that day.
Moments later, Tencent updated the numbers to reflect the government’s “official” numbers that day. Netizens noticed that Tencent has on at least three occasions posted extremely high numbers, only to quickly lower them to government-approved statistics.
You can read the article yourself here.
I don’t know if this report is true or what the situation is. I’m not an epidemiologist. It just makes more sense to me when I think why would they put an entire city of 11mn people on virtual lock-down? It must be really, really serious for them to be taking such measures. I can’t help but think that it won’t be over this soon or this easily.
The risk-on tone was also helped by better-than-expected figures from the US. The ADP report was stunning: 291k new jobs vs expectations of +157k, thanks to mild weather, which boosted employment in the construction industry. However, don’t expect that to translate automatically to a better-than-expected nonfarm payrolls on Friday. Remember that the ADP report overestimated last month’s NFP by 57k (39% of initial NFP figure) and underestimated the month before by 142k (53%). Also the ISM non-manufacturing PMI beat estimates at 55.5 vs estimates of 55.1 (previous 55.0) and the Markit US services PMI was revised higher. That helped to push the dollar higher.
As for today, it’s all down to coronavirus news. If no new bad news comes out, I’d expect the “risk on” recovery to continue, with predicatable results on the currencies.
Today’s market
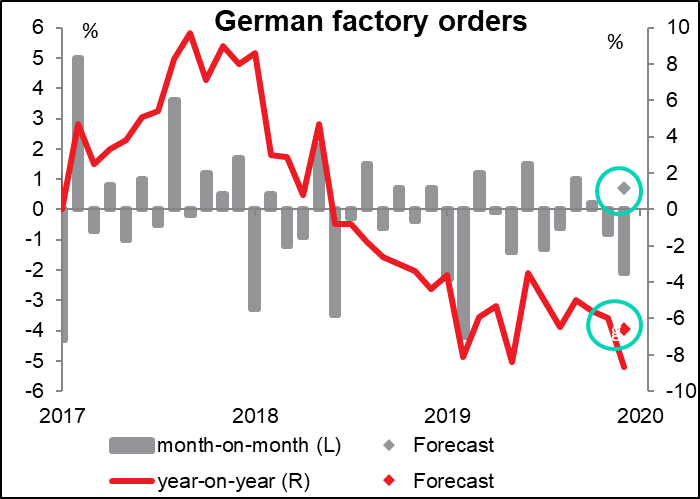
The day started with German factory orders, which I discussed in yesterday’s comment because I knew full well I’m never going to get this comment out in time. The figures were much worse than expected: -2.1% mom vs +0.6% expected (previous month revised up to -0.8% from -1.3%) The breakdown between domestic & export isn’t available yet.
After that…nothing but jaw jaw jaw! ECB President Lagarde will give an introductory statement at the quarterly hearing before the Committee on Economcy and Monetary Affairs (ECON) of the European Parliament, but she’ll probably just repeat the introductory statement from the last ECB meeting press conference.
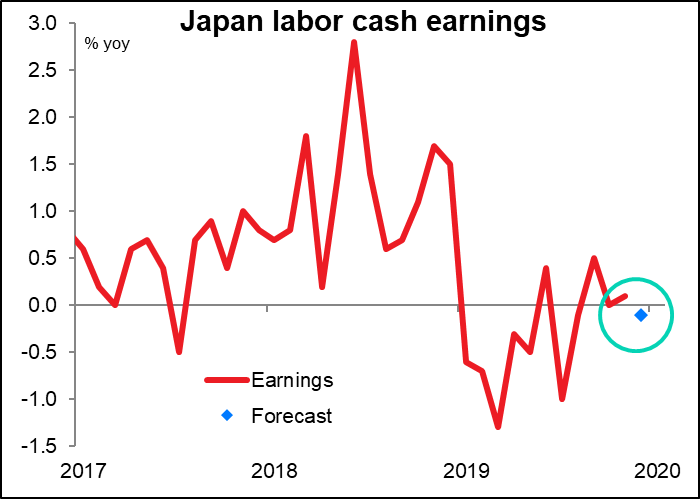
Overnight, Japan announces its labor cash earnings, which should be major indicator but isn’t, because a) the office that compiles the statistics lied about them, and b) no one believes the Bank of Japan will change policy anyway. I suppose the most important thing about this series is that it demonstrates that a tight labor market doesn’t inevitably lead to higher inflation. Japan has an astonishing 2.2% unemployment rate and 1.57 jobs for everyone looking for a job, and yet earnings are expected to fall on a yoy basis. JPY neutral
The Reserve Bank of Australia’s (RBA) Statement on Monetary Policy (SMP) will give details of the RBA’s forecasts.
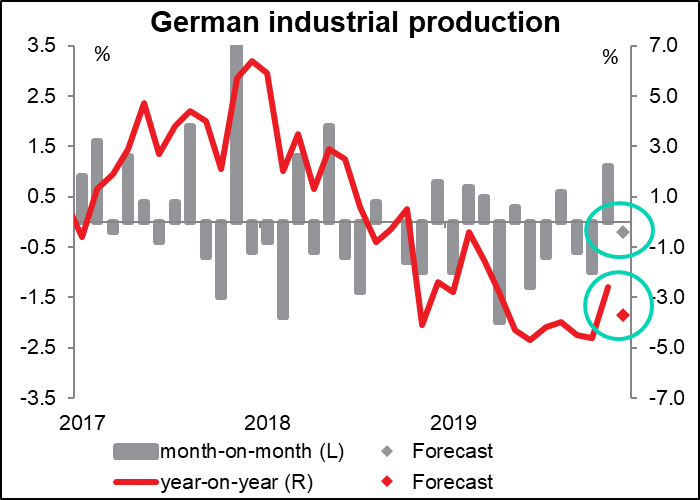
Then once again we get some early-morning German indicators: industrial production and the trade balance.
German industrial production is forecast to be down slightly on a month-to-month basis, with the year-on-year rate also declining further. As mentioned above, yesterday’s German factory orders were down much more than expected, meaning this figure is likely to be bad too this month or next.
Meanwhile, the German trade surplus is expected to diminish considerably. That’s EUR negative, unless of course people think that it’ll help to take some of the US pressure off of Germany about trade. But I don’t think the US administration is that sophisticated.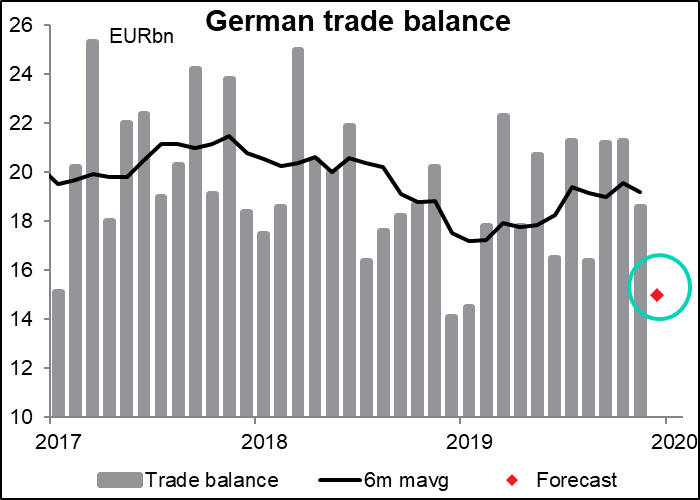
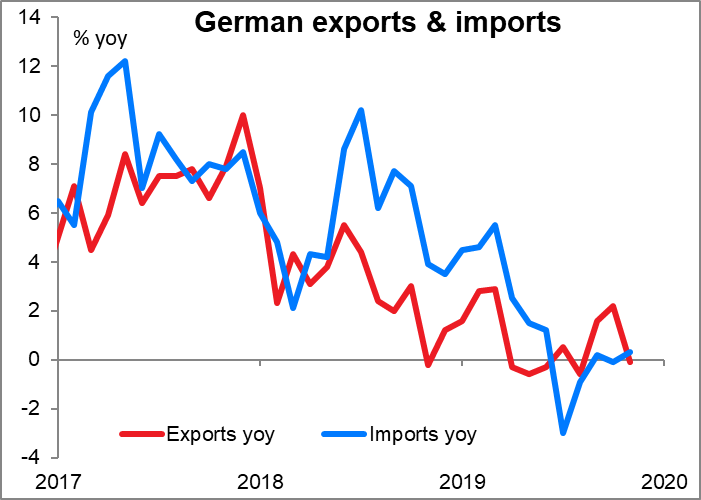
I’m mystified by this, however. Exports are forecast to be up 0.6% mom while imports are forecast to rise only 0.3% mom. Since Germany has a trade surplus, it’s obvious that epxorts are greater than imports. So if a bigger number is increased by a larger percentage than a smaller number, the difference between the two should be even bigger, no? It seems to me then that the trade surplus should rise, not fall. (The following graph uses the yoy rate of change, not the mom rate.) My only guess is that it has something to do with the seasonal adjustment process, which can change up to down.
