Rates as of 05:00 GMT
Market Recap
Wow! Today is a WOW day! The S&P 500 was up a whopping 9.4% (ok, so it’s still down 24% YTD, but it’s a lot better than the day before). It’s been volatile during Asian trading; first down, then up after the US Senate agreed on a $2tn stimulus bill, but now down 0.7%. It’s hard to write a comment when the numbers keep flashing from red to green and back again.
As for the Senate agreement, you can read the details here. They include expanded unemployment benefits; loans for big companies, small companies, hospitals and other miscellaneous enterprises; a check for $1,200 for everyone who makes up to $75k; and most importantly, an inspector general and oversight committee. The original Republican plan was that the identity of those getting the money could remain secret for up to six months, which would’ve allowed them to use it as a secret slush fund to channel money to their supporters, including Trump-owned companies.
The amount is big but certainly not the biggest on a global scale – $2tn is about 10% of GDP. But if we add in the Fed programs we get to a potential $6tn, which is 30% of GDP, which certainly is enormous – the biggest one I know of. Shutting down the US economy entirely for one month would reduce annual GDP by 8.3%, so adding 30% of GDP would allow the US economy to go on as is for 3.6 months – long enough to get over this virus, I hope! (OK, that’s a very simplistic way of looking at it, but you get the idea. Also I’m not sure about whether the amount is double-counting the Fed loan programs – are they included in the stimulus package? It’s not clear to me)
The reason this particular package is so significant is that the US economy is the largest economy in the world and a major engine of growth for everyone else. If the US economy were to implode, then everyone else would implode too. With that worst-case scenario now off the table, investors are more confident that the monetary and fiscal measures are in place to support the global economy while the medical experts take the necessary steps to overcome this crisis.
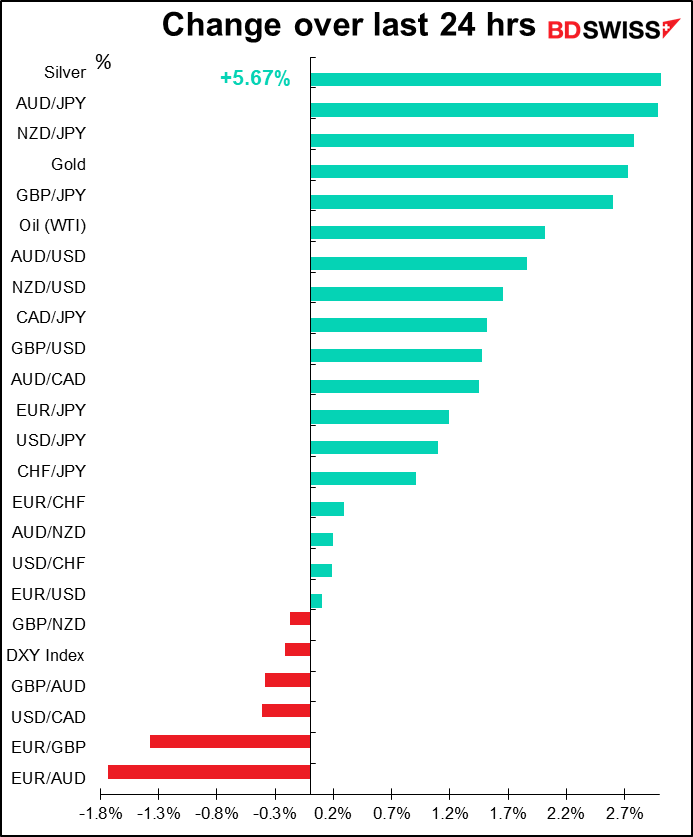
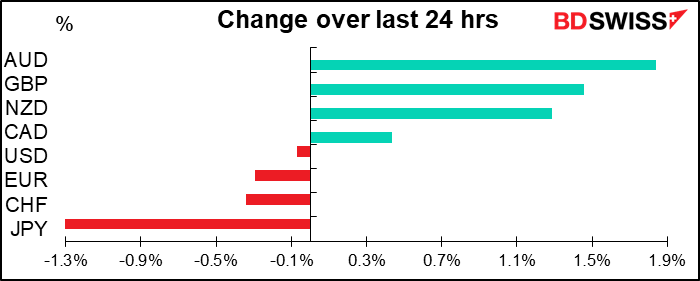
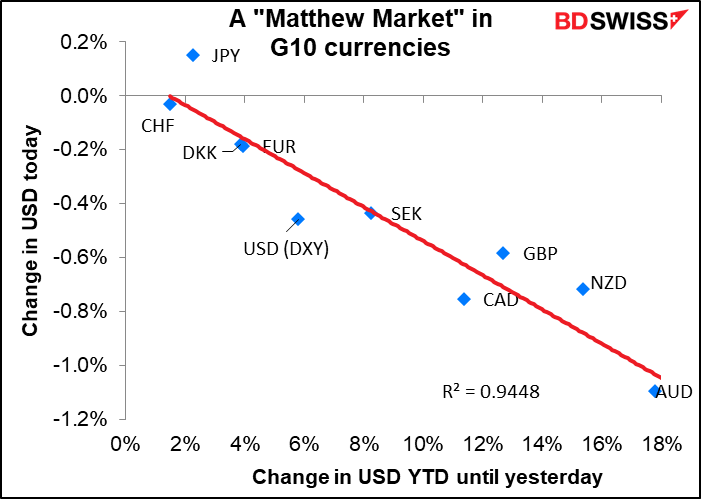
That confidence spilled over into the FX market this morning, resulting in a typical “risk on” day. We’ve had a perfect “Matthew Market,” where the currencies that were hit the most this year were the ones to gain the most today (the r2 of 0.94 is about the highest I’ve ever seen in any naturally occurring phenomenon). (the term a “Matthew Market” comes from the Matthew 20:16 in the Christian bible, where it says “so the last will be first, and the first last.”)
I believe this momentum can last for some time, at least a day or two, as burnt-out traders look for something hopeful. The main danger, in my view, is that Trump keeps trying to restart the economy and get everyone out of their house too early and that just causes a relapse.
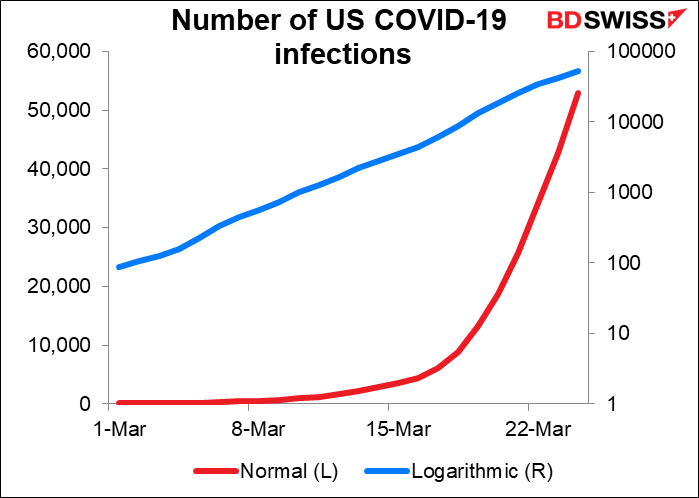
The graph below shows the number of COVID-19 infections in the US. The red line is the number as normally displayed, the blue line is logarithmic scale. That’s crucial to understanding the likely progress, because what the relatively flat logarithmic line shows is that the epidemic is spreading at quite a steady pace. Unfortunately it’s spreading at a steady exponential pace – it’s doubling every two or three days. People may not understand the implication of this. As physics professor Al Bartlett once said, “The greatest shortcoming of the human race is our inability to understand the exponential function.” What this graph implies is that at the current pace, between 12 and 18 days from now (six more doublings) there will be 3.4mn cases in the US. If 10% of those need to be in intensive care, it will mean 340k people trying to get into hospitals, which will overwhelm the US health care system.
This is why I’m still medium-term bearish on stocks and therefore think that “risk off” is probably more likely over the next few weeks at least. I think we’ll have to see a medical solution as well as a fiscal and monetary solution before the markets sound the “all clear.”
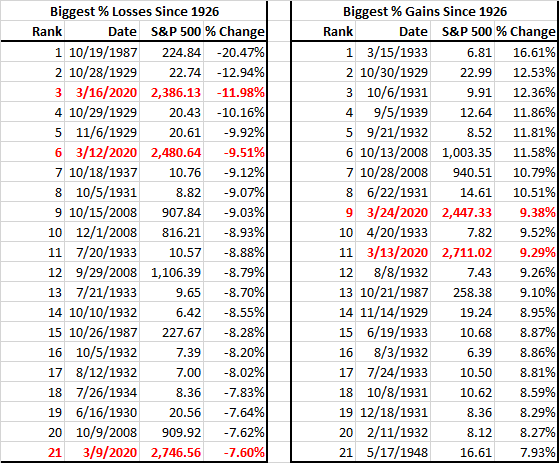
Getting back to markets, to show you how volatile the stock market is now, noted analyst Jim Bianco put together this table of the 21 biggest ups and downs of the S&P 500 index since 1926. There are five days in March on this list so far (I don’t rule out more – we still have a few days left to go!). In other words, 12% of the most volatile days since 1926 have been this month.
Yesterday’s PMIs
I don’t usually like to review the previous day’s data, because I think that kind of information is widely available from people who do it earlier and more thoroughly than I do anyway. But yesterday’s purchasing managers’ indices (PMIs) from the major industrial economies are well worth looking at as the first hint of what the impact of this virus is going to be.
Answer: not good.
The following table gives the market “expectations” and what the actual figure was compared to the previous. It shows what the market expected the change to be and what the change actually way.
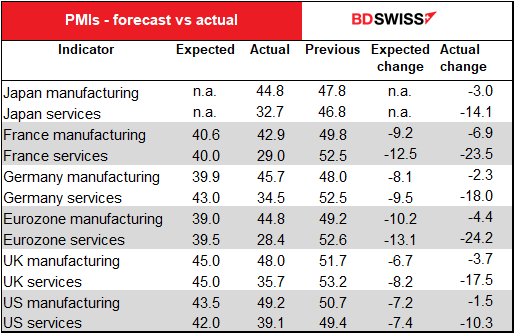
The table shows us that:
- the market largely expected both manufacturing and services to fall a comparable amount, but in fact
- manufacturing consistently fell less than expected while services fell more than expected
- In fact, manufacturing fell relatively little in some cases, while
- Services collapsed across the board
- When it comes to the economic implosion, the Eurozone is ahead of the UK, which is ahead of the US.
- I’m surprised by Japan, as they haven’t been taking any aggressive measures to enforce social distancing or shutting down stores, and from what my daughter in Kyoto says, life goes on pretty much as normal there.
I don’t think we should read too much into the forecasts, because of course no one really knew what to expect. What’s important is that services have reacted relatively quickly to the virus. That’s important, because in the industrial countries, most people are employed in services (in the US, 84% are in services and only 16% in manufacturing, and that’s excluding the government). So anything that affects the usually stable service sector that much is bound to have a huge impact on the economy.
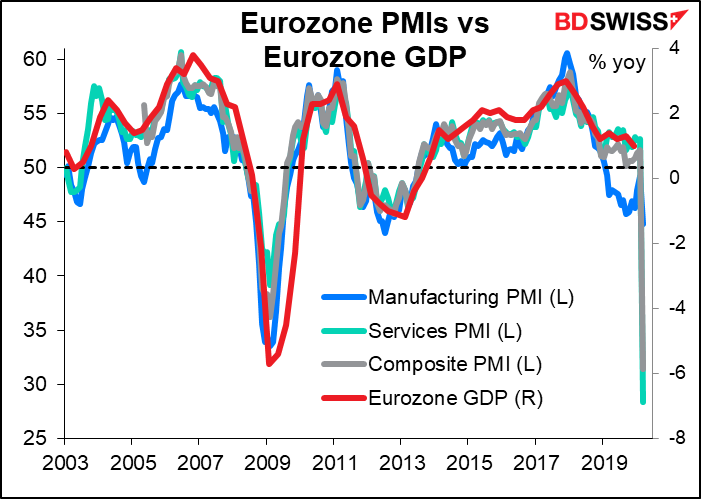
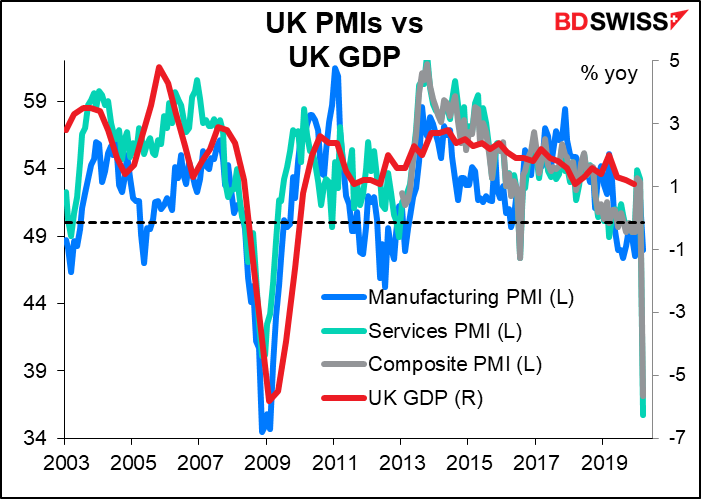
The following graphs show how the PMIs match up with GDP in the major economies that released their preliminary PMIs yesterday. As you can see, if the relationships hold, then we’re in for an unprecedented economic implosion in Q2. Which at this point would not be a surprise. The only question is, can we get over this quickly enough to bounce back in Q3 or Q4?
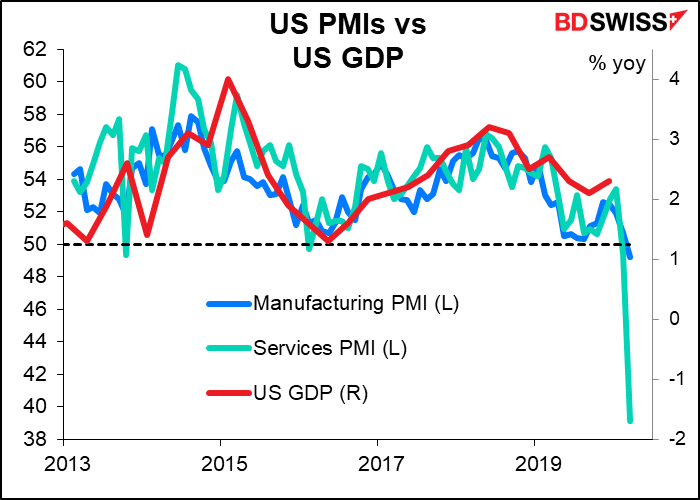
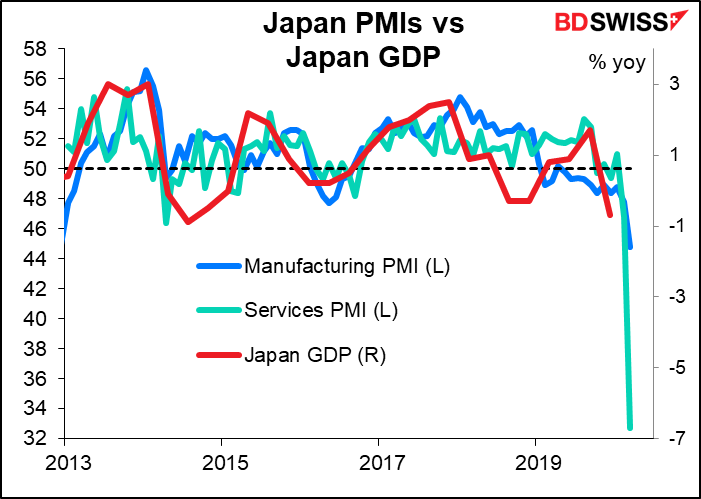
(I learned one other worthwhile point from this exercise: why the market largely ignores the Japan PMIs. It’s because they don’t have as good a correlation with GDP growth as they do in other countries.)
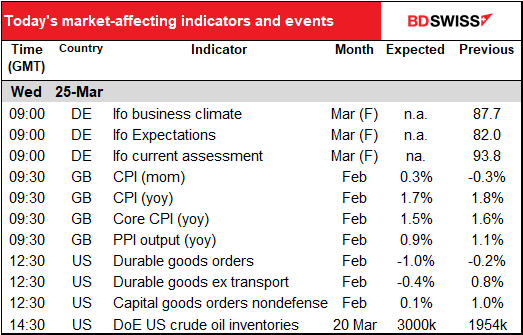
Today’s market
The European day starts with the final figures for the Ifo survey. This was the first time (that I know of) that the Ifo released preliminary results, so no one has a clue how different the final figures will be. No forecasts.
Britain releases its consumer price index (CPI). Usually this would be a big deal. Now, with interest rates in Britain essentially at the zero bound, it’s of only academic interest, because the central bank isn’t reacting to inflation anyway. Even if inflation does slow – which is what today’s figures are indicating – it’s not going to convince the BoE to ease policy any further.
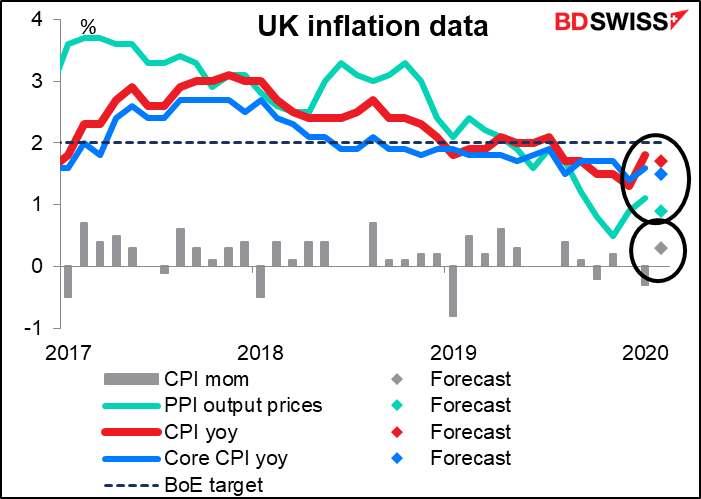
As inflation data comes out from various countries, it will be interesting to see if the demand shock (the collapse of demand) outweighs the supply shock (the collapse of supply chains, the interruption of transportation links, closing of many outlets, etc.) Headline inflation is bound to fall because of the plunge in oil prices, but I don’t know about core inflation. Come to think of it, I wonder if they can even compile the data – to calculate the CPI, they have to collect prices from a wide variety of stores, but what will they do in countries where the stores are all closed? No idea.
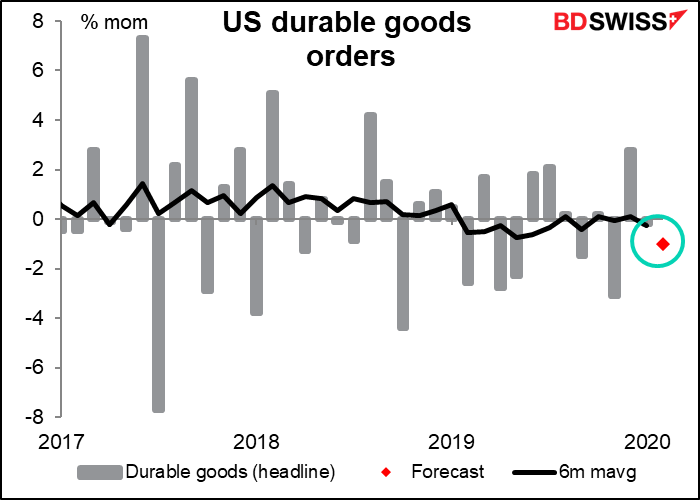
US durable goods orders in February are expected to be down no matter how they’re measured. Investment wasn’t the bright spot in the US economy. The extra money that companies got from tax breaks went to stock buybacks to boost management’s option-linked pay, not to investment. But who am I to mention such things? Anyway if no one was investing before the virus hit, we can hardly expect an improvement afterwards.
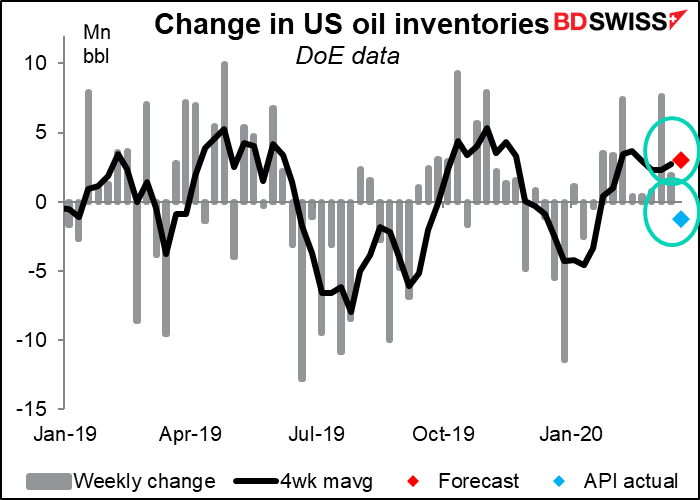
The weekly US oil inventory figures are going to be closely watched nowadays as people wonder just how bad the oil glut is. At the moment, it’s not that bad in the US, contrary to what you might expect if you were just looking at the price. In fact, US inventories are bang in line with where they historically are this time of year.
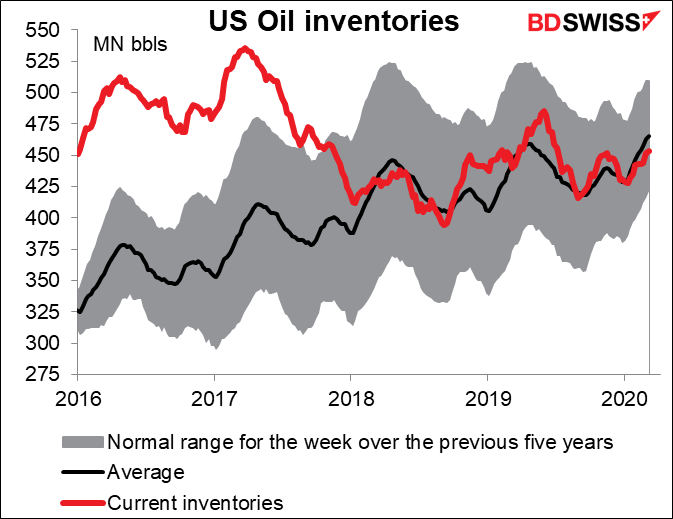
Today’s figures are forecast to show an increase of 3mn bbl, which would be in line with the recent trend. However, yesterday’s data from the American Petroleum Institute (API) showed a surprise drawdown of 1.247mn bbl.