Rates as of 05:30 GMT
Market Recap
I hope everyone enjoyed yesterday, Palindrome Day (02/02/2020) – of course it’ll be a long time before we get to 03/03/3030, but next year we can look forward to 12/02/2021.
The coronavirus crisis worsens and worsens. An ABC News video taken from a drone shows that the epicenter of the virus, Wuhan – a city of 11mn people, bigger than New York – is virtually a ghost town with almost no movement or economic activity. In the port city of Wenzhou, the government ordered residents to assign only one member to leave house to buy goods every two days (with some exceptions). Oh, and just in case that wasn’t enough: officials also announced an outbreak of a highly pathogenic strain of H5N1 bird flu at a farm in Hunan! Not to mention a headline in the Daily Mail that caught my attention: “Band of herpes-ridden monkeys are roaming residential neighborhoods in northeast Florida…” It does seem that the end of days is nearing.
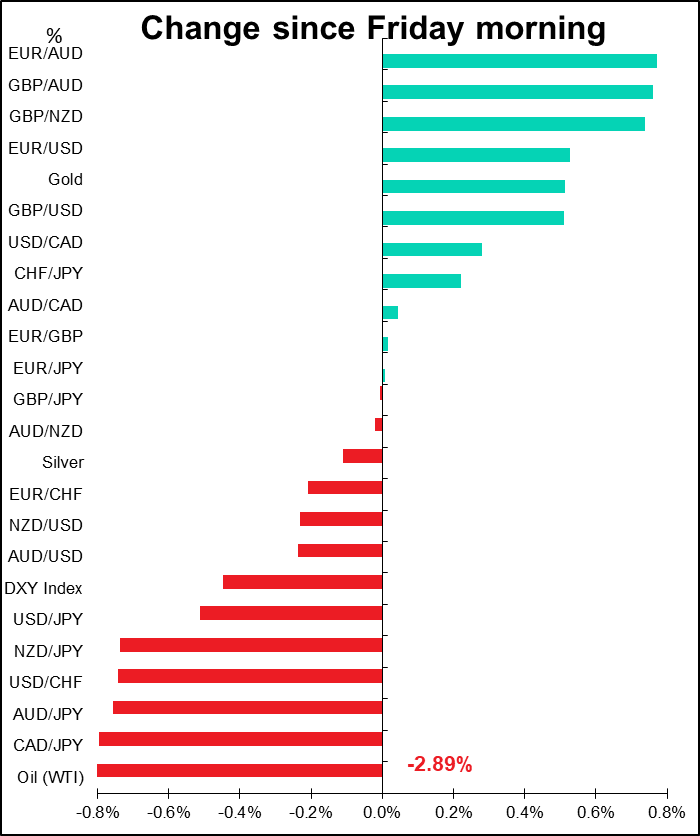
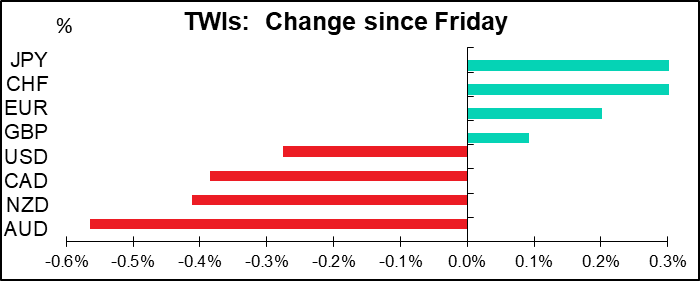
It’s no surprise then that the dominant theme in the market is a general “risk off” move. We’ll probably see this continue for some time, in my view, as the virus spreads to other countries that perhaps report the infection and death toll more accurately than China does. US stocks have now lost all their gains for the year so far.
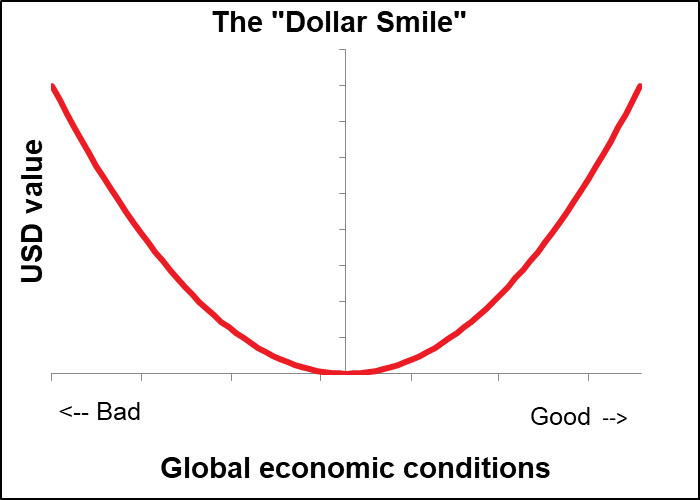
What surprised me about the market this morning is that it’s not following the usual path that the “dollar smile” thesis would indicate. That’s the idea that when things are good, people buy USD because the US economy is the strongest and interest rates are (currently) the highest in the developed world. When things are bad, — like in 2008, or now with the coronavirus – people buy USD because it’s the ultimate “safe haven” currency. It’s when we’re in a “Goldilocks” scenario, neither too hot nor too cold, that people sell USD and buy EUR. But this didn’t happen, at least not on Friday. I’m not sure why this was, unfortunately.
Chinese markets reopened sharply lower after the Lunar New Year festival and were down sharply, with stocks off around 8% and the onshore CNY off by over 1% vs USD. Several futures contracts went limit down, such as iron ore, copper, crude oil and palm oil.
The Chinese government acted quickly to calm the financial markets by injecting CNY 1.2tn through 7- and 14-day repos. This is a huge gross amount, but actually there’s more than CNY 1tn maturing today, so the net injetion is more like CNY 150bn, not so enormous. However it cut the cost of the funds by 10 bps. The move was successful in stopping the momentum and turning sentiment around. The “risk off” mood was passing as I write – USD/JPY and AUD/JPY were headed back up, while EUR/USD was headed down. I’m not sure how long this stability will last, however.
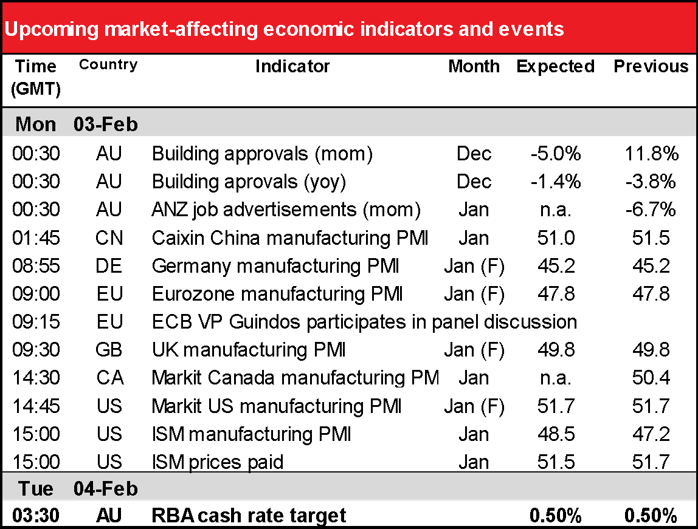
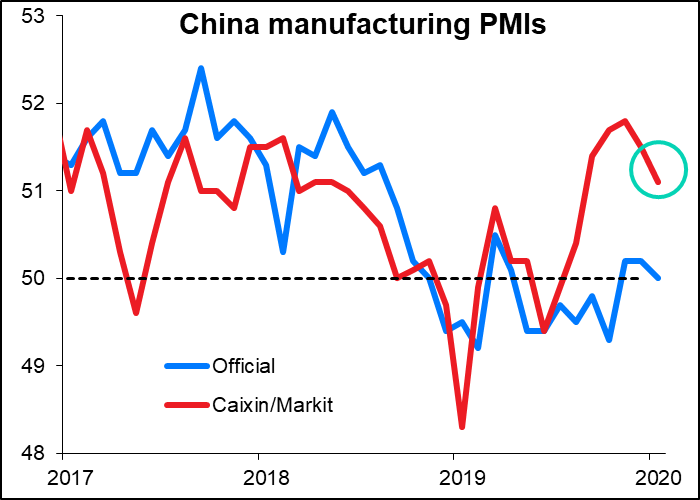
Overnight we got the Caixin/Markit China manufacturing purchasing managers’ index (PMI). It fell to 51.1 from 51.5. That’s still quite a healthy level. However, the data are for January – the survey was conducted from Jan. 13 to 22, meaning the early submissions didn’t take the coronavirus into account at all. We have to wait to see what happens in February, when the survey will take into account the full brunt of the virus. For example, looking at the components of the index, business expectations rose quite strongly, probably due to optimism after the “Phase One” agreement between the US and China, even while export orders were down. I doubt if that optimism will be repeated in February.
Commitments of Traders (CoT) report
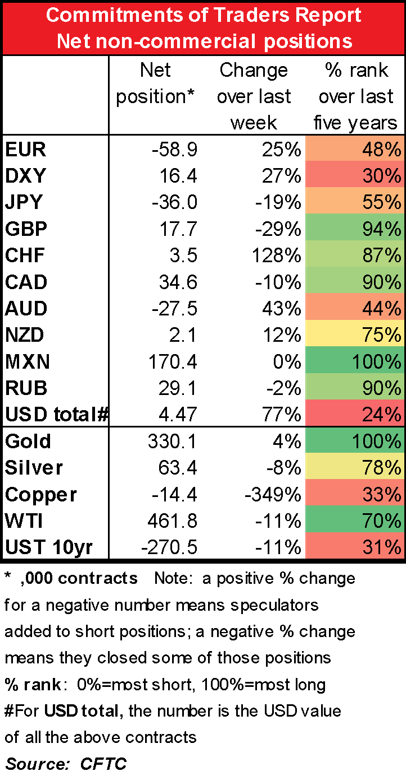
The CoT report showed some big moves last week!
Specs added to short EUR and long DXY positions, which is what I would’ve expected during this crisis, thanks to the above “dollar smile” thesis.
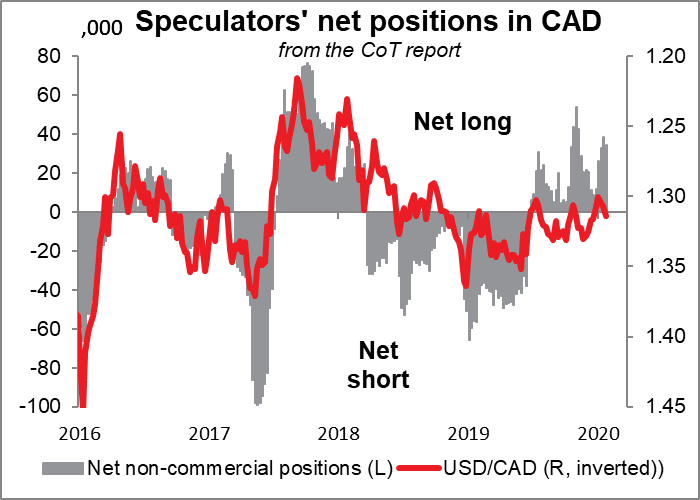
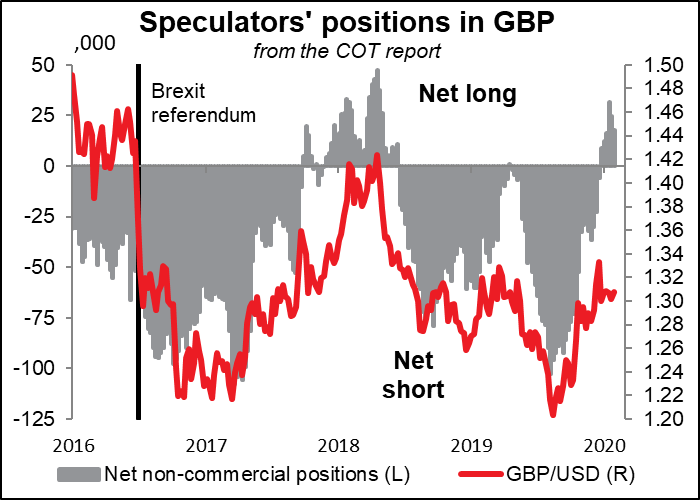
Specs cut long CAD and GBP positions. With CAD, I think the combination of the Bank of Canada’s recent change of view plus the plunge in oil prices makes it likely that specs will gradually switch to net short, pushing the currency down further.
I think there’s still more to go with GBP too. Frankly I can’t believe anyone’s long GBP, although I have to admit it’s been a winning trade since last August. Which just proves a statement attributed to Keyenes: the market can remain irrational longer than you can remain solvent. Although in this case, I suppose the bottom for GBP/USD was discounting a “worst case scenario” of crashing out of the EU with no agreement and maybe J. Corbyn as Prime Minister, which ultimately did not happen.
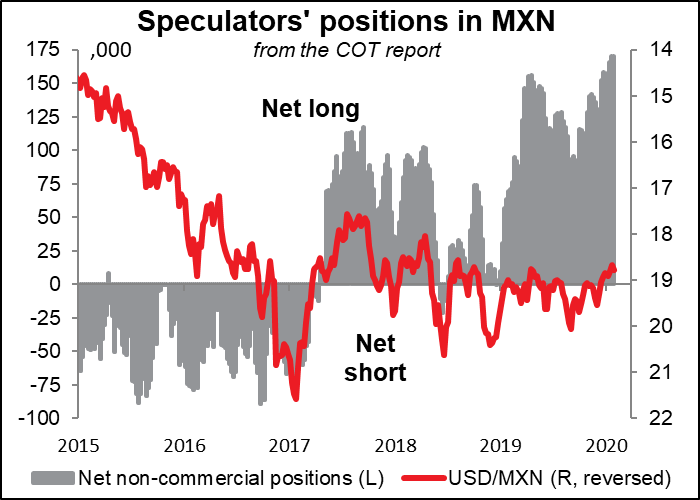
MXN and RUB look massively overbought for a time when oil prices are plunging. People looking for a short might want to look there. I admit I don’t follow these two economies so I don’t know if there’s anything else going on with these countries that would cause speculators to be stuffing their boots with their currencies – Mexico for example actually makes more money from trade in autos than trade in oil – but still, specs are the longest they’ve ever been (not just in the last five years).
Today’s market
The main event for today is overnight, when the Reserve Bank of Australia (RBA) meets. That’s followed by Gov. Lowe addressing the National Press Club on Wednesday and the quarterly Statement on Monetary Policy (SMP) on Friday, with its updated forecasts. So it’s a big week for AUD, mate!
The market is getting increasingly convinced that there will be two RBA rate cuts this year.
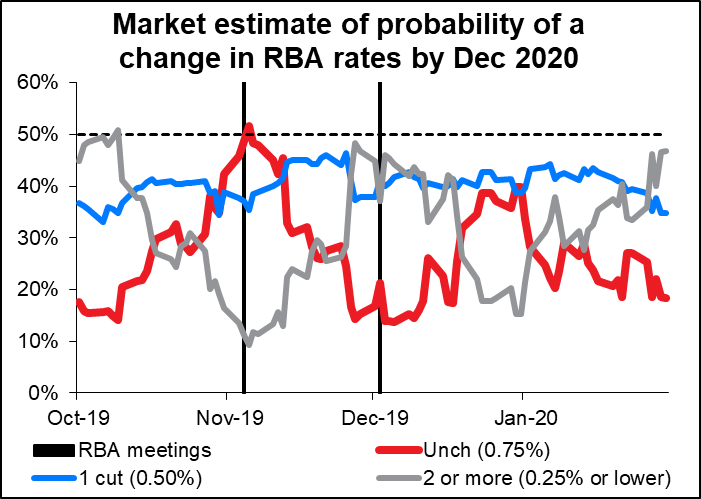
The fundamentals already supported some loosening this year: Inflation remains below target and the unemployment rate, perhaps an even more important metric for the RBA, is stubbornly above their estimate of full employment. Add to that the disastrous bush fires around the country and there’s good cause for the central bank to take out some “insurance” against a downturn in the economy.
Now on top of that comes the coronavirus, which is liable to hit Australia hard. China is far and away Australia’s biggest trade partner, with 31% of total exports of goods and services going there. The top five exports and China’s share in Australia’s trade are as follows:

The impact of the virus on Australia depends to a great degree how much Chinese industry is affected. If factories aren’t running, then demand for iron ore will obviously suffer. Coal and natural gas too, although less in that households will still use electricity. Tourism is obviously quite vulnerable, but its impact on the economy is not that great. I think the coronavirus adds to the already strong argument for one easing and at the margin may push the scale over to two easings, depending on how long the epidemic lasts and what its effect on output is – something we don’t know yet.
I would expect the RBA to take a noticeably more cautious stance, which is likely to result in some downward pressure on AUD (if it’s not already discounted). At their last meeting in December, the RBA was starting to get optimistic; they said, “The outlook for the global economy remains reasonable” as some of risks “have lessened recently.” Specifically on China, they noted that “the authorities have taken steps to support the economy while continuing to address risks in the financial system.” Obviously their view on China will have to change and with that, the whole tenor of the statement is likely to become more cautious.
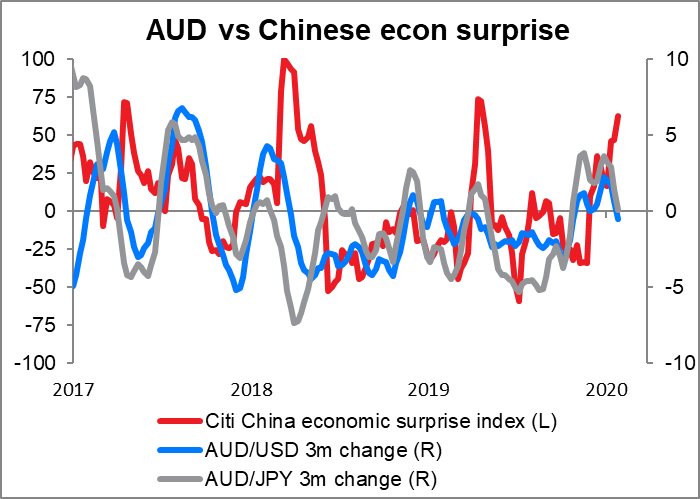
As for AUD, again much depends on what happens with Chinese economic activity. AUD/USD and even more, AUD/JPY has a good (but by no means perfect) with the Chinese economic surprise index. Note though sometimes, like 2018, the currency moves well in advance of the Chinese data. That’s clearly happening already.
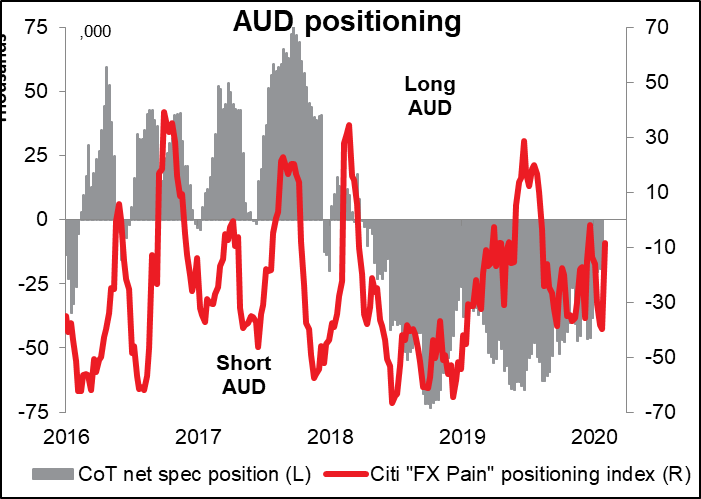
Positioning in AUD is modestly short. Speculators are short, but not unusually so, according to the COT report, the same result as the Citi “FX Pain” positioning index of currency fund managers. There’s still plenty of room for people to add to short positions.
Today’s indicators
One reason I”ve been going on so much about the RBA meeting is that there isn’t that much else to talk about today (since I get paid by the word, that’s a disaster for me). The final manufacturing purchasing managers’ indices (PMIs) for the major economies are coming out. These are sometimes revised, but the revisions don’t make as big a splash as the originals. At the same time, a lot of other countries’ PMIs are coming out, but these tend not to be as market-moving.
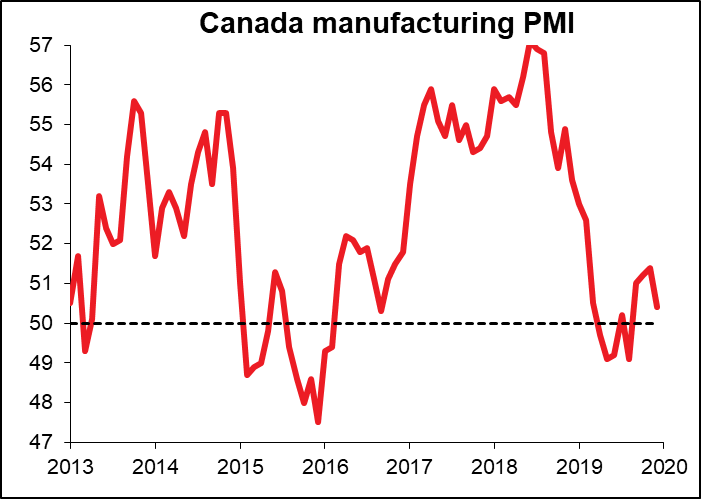
One surprise: the Markit Canadian manufacturing PMI was highlighted as “very significant” on the Bloomberg economic calendar. This is a function of how many Bloomberg subscribers have chosen to get an alert when the number comes out, so it’s an objective measure of market interest. Maybe I just never noticed it before, but this is the first time I’ve ever seen that. In any event there aren’t any forecasts for it, but traders with a CAD position should take notice. Canada also has the Ivey PMI index, which will be released on the 7th – that has minimal market interest.
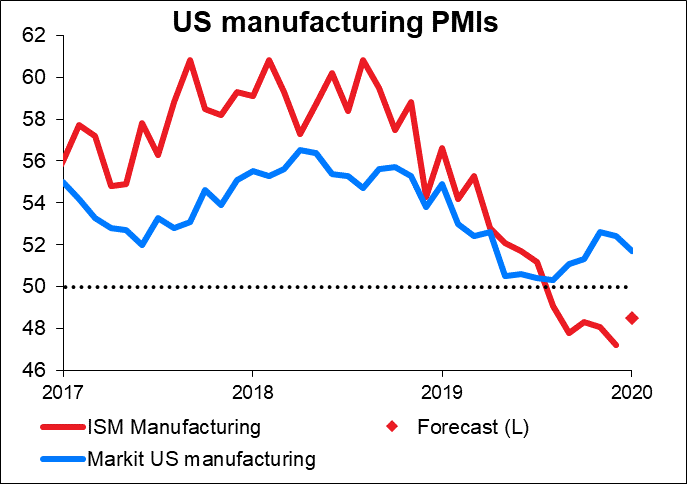
The major indicator of the day then is the Institute of Supply Management (ISM) manufacturing PMI. This one seems to be more volatile than the Markit version, and currently is much lower. Have you ever wondered why? According to Markit:
- Survey panel sizes are different: IHS Markit surveys just under 800 manufacturing companies, approximately double the size of the ISM panel size. As a general rule, a large panel size produces more stable and accurate survey results.
- Different panel structures: ISM data are based only on ISM members, and as such are likely to reflect conditions in larger multinational companies. In contrast, HIS Markit’s survey is based on a mix of companies of all sizes, including small- and medium-size enterprises, that reflects official data on the composition of manufacturing output.
- Survey responses may relate to different markets: IHS Markit specifies that all responses must relate only to US factories and facilities, whereas ISM does not. ISM data could therefore be more heavily influenced by conditions of US-owned factories in China, for example.
The result? “Using some simple statistical analysis, it is evident that the IHS Markit indices have a stronger relationship with official output, factory orders and employment data than the equivalent ISM indices.” You can read their full explanation here.
So according to Markit, their PMI is much better than the ISM’s. Of course MRDA — I haven’t seen the ISM’s explanation. But more to the point, we’re not engaged in an academic research program on the US economy, we’re trying to forecast the market. We don’t really care which is better, we just care which one the market thinks is better or more accurately which one is going to move the currency market more, and the answer is probably the ISM, which has a much longer history in the US (back from 1948, when it was the National Association of Purchasing Managers.) So pay attention even if you shouldn’t! The forecast upturn today is likely to be USD positive.