PREVIOUS TRADING DAY EVENTS – 20 April 2023
Announcements:
“Inflation is still running red-hot and it remains well outside the central bank’s target range,” said Satish Ranchhod, senior New Zealand economist at Westpac in Auckland. “However, it’s looking increasingly likely that May will be the last rate hike in the current cycle. Inflation has fallen well short of the RBNZ’s forecasts for a second quarter.”
Fears for recession also grow in New Zealand with the aggressive increase in borrowing costs. House prices are falling and businesses are downbeat while prices remain persistently high for some goods and services
During the last policy review on April 5, the RBNZ said demand “continues to significantly outpace the economy’s supply capacity,” thereby maintaining pressure on inflation.
The labour market was gradually slowing as a result of the Federal Reserve’s year-long interest rate hikes. All data show that the economy is slowing down significantly and recession fears are growing. Retail sales are down, manufacturing activity is down and banks tightening lending.
“After months and months of watching, for the first time we can say we see a recession coming and it will be a miracle if we don’t have a downturn in the economy,” said Christopher Rupkey, chief economist at FWDBONDS in New York.
The U.S. central bank still intends to raise rates next month before finally giving a pause to its long-lasting rate hiking campaign.
Sources: https://www.reuters.com/markets/us/us-weekly-jobless-claims-increase-moderately-2023-04-20/
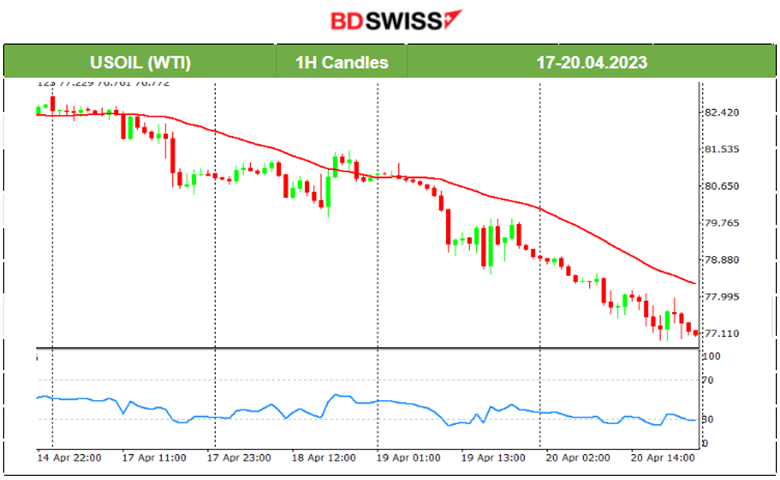
Since the OPEC+ surprise output cut announcement the price of Crude has surged for a short period of time reaching more than 81.5 USD per barrel. Since then, the price has settled moving roughly sideways and around the mean, 81 USD level. Starting from the 14th of April, it moved to a surprisingly lower price level and continued its further and steady downward movement even until today.
Technical analysts see this as a technical correction since the surprise cuts caused abnormal movements. A sudden spike in prices — such as the one that occurred after OPEC and its allies announced an unexpected production cut — causes a breach in charts, a gap that needs to be filled.
“Large technical chart gaps like we’re seeing in the futures keep most traders very nervous,” said Dennis Kissler, senior vice president of trading at BOK Financial Securities. “After a gap like that occurs, more times than not, the market will migrate downwards.”
______________________________________________________________________
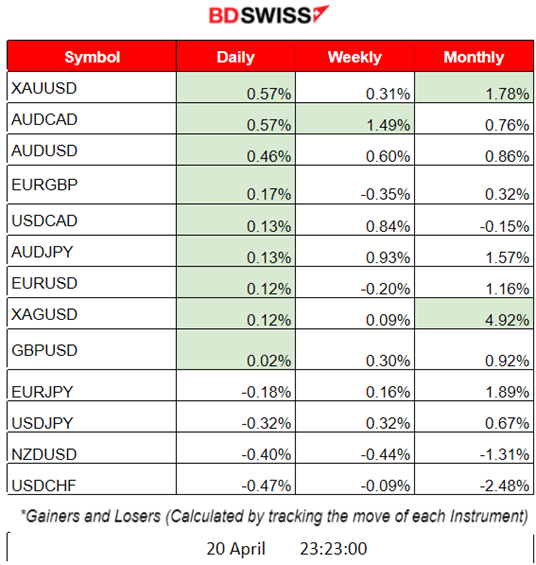
Summary Daily Moves – Winners vs Losers (20 April 2023)
______________________________________________________________________
News Reports Monitor – Previous Trading Day (20 April 2023)
Server Time / Timezone EEST (UTC+03:00)
- Midnight – Night Session (Asian)
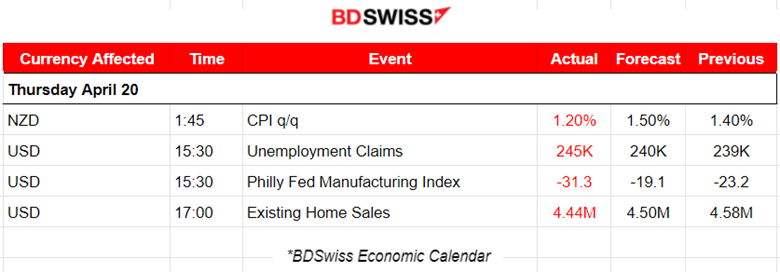
At 1:45 the CPI figure for New Zealand was released. 1.2% was less than anticipated and less than the previous 1.4% figure, showing that inflation slowed way more than economists’ expectations and that the central bank might stop raising interest rates aggressively. At that time the NZD depreciated heavily. NZDUSD dropped more than 30 pips.
- Morning – Day Session (European)
At 15:30 Unemployment Claims were reported to be 245K, an increase of 5,000 from the previous week’s revised level. The index measuring the current general activity of the Federal Reserve Bank of Philadelphia’s Manufacturing Survey dropped to -31.3 in April from -23.2 in March. The USD depreciated at the time of the two releases. EURUSD jumped more than 35 pips.
General Verdict:
______________________________________________________________________
FOREX MARKETS MONITOR
EURUSD (20.04.2023) Chart Summary
Server Time / Timezone EEST (UTC+03:00)
Price Movement
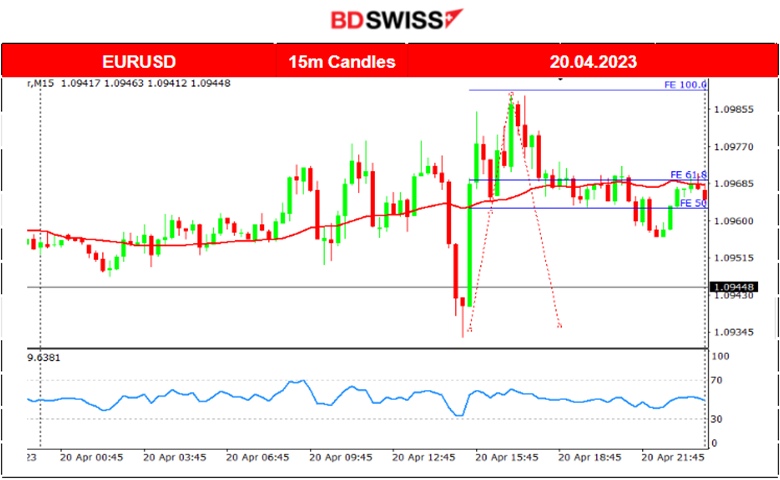
The pair was experiencing low volatility and sideways movement during the Asian Session. At the European Markets opening we witness further volatility and the shock that it experienced at 15:30. At that time the U.S.-related figure releases caused the USD to depreciate pushing the EURUSD upwards more than 45 pips.
Trading Opportunity
After the shock, we look for retracements. This is actually a reversal while the price moves rapidly, crossing the 30-period MA moving upwards and eventually finding resistance. It enhances even further the chances for retracement. The Fibonacci Expansion helps in identifying the level at which the price will retrace which is near the MA, the mean. Retracement reached even the 50% Fibo level.
NZDUSD (20.04.2023) Chart Summary
Server Time / Timezone EEST (UTC+03:00)
Price Movement
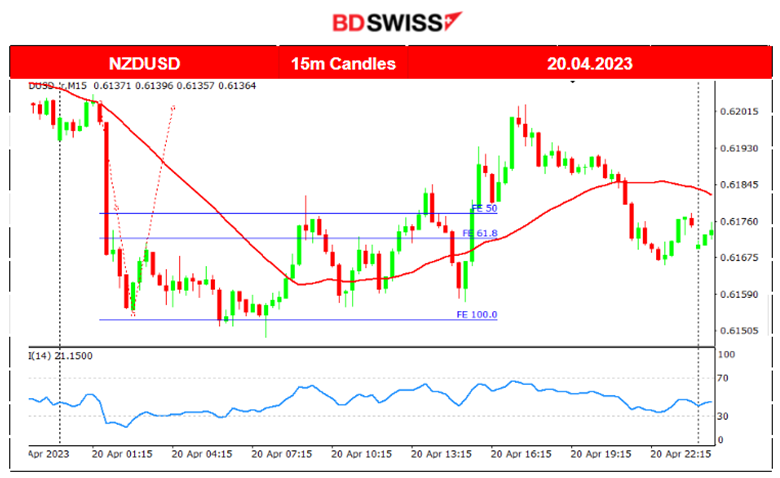
At 1:45 the low CPI change figures for New Zealand caused the NZD to depreciate heavily. The NZDUSD at that time experienced a dive of more than 30 pips. The shock ended soon when it found resistance and the price reversed with high volatility, moving mainly sideways around the mean during the rest of the trading day.
Trading Opportunity
After the shock at 1:45, we use the Fibonacci Expansion tool to identify the Fibo level 61.8 that the price potentially will retrace to. It did quite soon intraday.
____________________________________________________________________
EQUITY MARKETS MONITOR
NAS100 (NDX) 4-Day Chart Summary
Server Time / Timezone EEST (UTC+03:00)
Price Movement
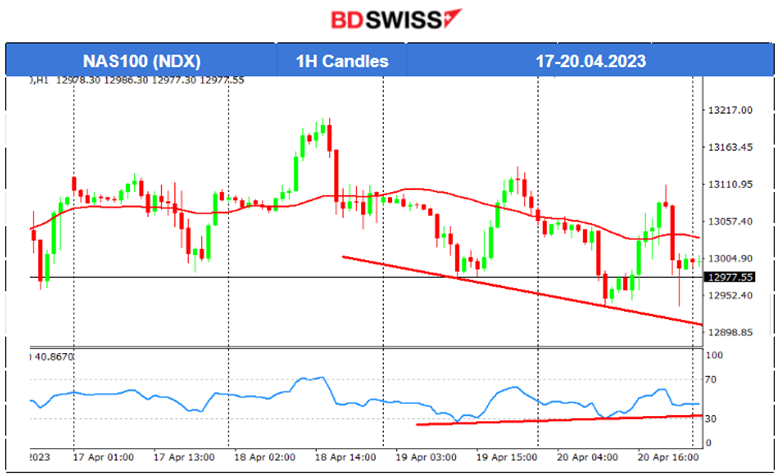
U.S. stocks continue their sideways path with high volatility. Main U.S. indices are showing that the 30-period MA is somehow turning to the downside. It is not so clear since volatility is high. 12930 USD is a significant support level for the index. Breaking that level will signal the start of a trend and a further downward movement.
______________________________________________________________________
COMMODITIES MARKETS MONITOR
USOIL (WTI) 4-Day Chart Summary
Server Time / Timezone EEST (UTC+03:00)
Price Movement
The downward trend continues as the Oil price fell for the 4th consecutive day. It moves below the 30-period MA with a steady pace downward. The RSI is moving below the 50 level and it sometimes enters the oversold area, however, it only confirms the trend. Not to be used for any other reason at the moment.
XAUUSD (Gold) 4-Day Chart Summary
Server Time / Timezone EEST (UTC+03:00)
Price Movement
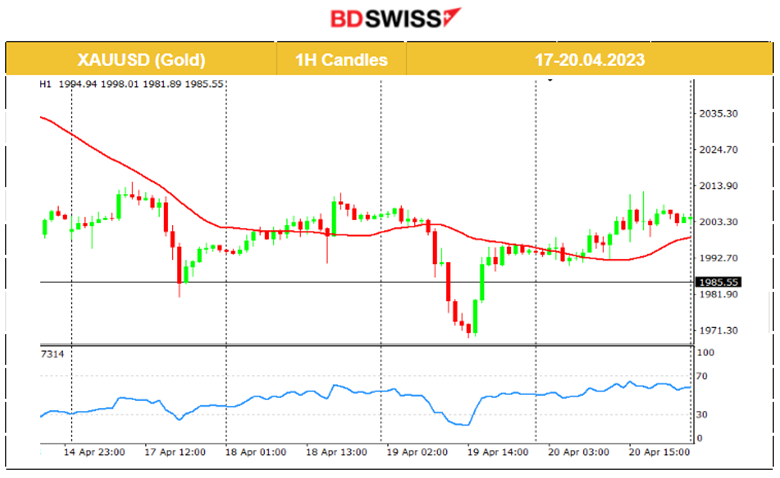
Gold is trading around the 2000 USD price level. There is high volatility involved and the price is affected by the USD-related figures, however, demand for Gold is clearly lower than the previous week. Gold reached 2050 USD on the 13th of April, the month’s peak. Since then, it dropped almost every day while experiencing rapid downward price movements and pushing gold lower in general.
______________________________________________________________
News Reports Monitor – Today Trading Day (21 April 2023)
Server Time / Timezone EEST (UTC+03:00)
- Midnight – Night Session (Asian)
No significant news announcements and no important scheduled releases.
- Morning – Day Session (European)
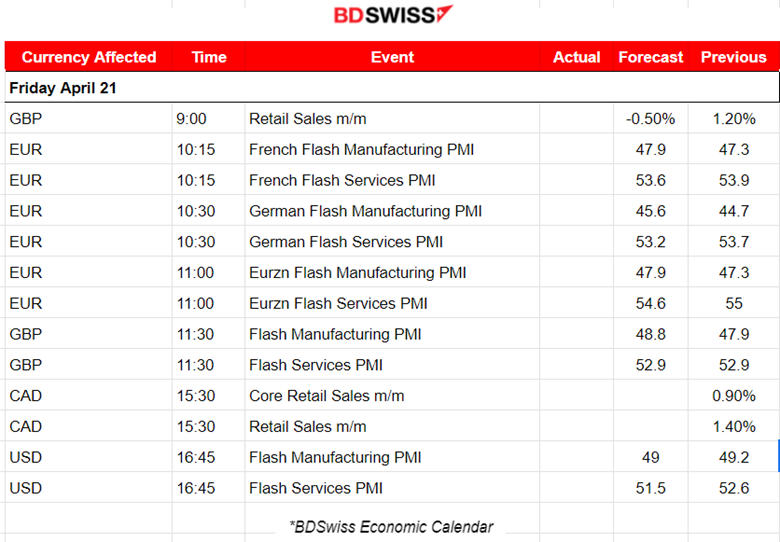
Today the trading day is dedicated to the PMI releases for both the services and the manufacturing sector for all major economies and regions (Eurozone, U.K., France, Germany, and U.S. PMIs). They do not usually cause shocks but cause the pairs to move in one direction or experience more volatility as they move sideways.
At 15:30 we have Canada’s Retails Sales release that might cause a short intraday impact on the CAD pairs.
General Verdict:
______________________________________________________________


