PREVIOUS TRADING DAY EVENTS – 05 April 2023
Announcements:
Risk-off mood in Wall Street, with bonds climbing and equities dropping. The dollar rose alongside the Japanese yen. Gold was near a 13-month high.
“Recession risks have increased,” said Mark Haefele, chief investment officer at UBS Global Wealth Management. “The equity outlook is challenging. As the slowdown of the US economy becomes more apparent, we think investors should prepare for a peak in interest rates by considering opportunities in bonds.”
“A much weaker-than-expected ADP private employment change tally was, and with other high-frequency labour market metrics, suggests deteriorating labour-market growth,” said Stan Shipley at Evercore ISI. “Whisper fears suggest a tepid jobs report on Friday.”
Source: https://www.bloomberg.com/news/articles/2023-04-04/stock-market-today-dow-s-p-live-updates
The Reserve Bank’s Monetary Policy Committee increased the Official Cash Rate to 5.25% from 4.75%, exceeding economists’ expectations. The RBNZs decisions show determination to get inflation back to its 1-3% target. The data support that the country is headed for an economic slowdown as desired, with lower prices. However, inflation is still too high.
“The Committee agreed that the OCR needs to be at a level that will reduce inflation and inflation expectations to within the target range over the medium term,” the RBNZ said in a statement. “Inflation is still too high and persistent, and employment is beyond its maximum sustainable level.”
“Looking ahead, the Committee is expecting to see a continued slowing in domestic demand and a moderation in core inflation and inflation expectations,” the RBNZ said. “The extent of this moderation will determine the direction of future monetary policy.”
Source: https://www.bloomberg.com/news/articles/2023-04-05/new-zealand-unexpectedly-lifts-key-rate-by-half-percentage-point?srnd=premium-europe#xj4y7vzkg
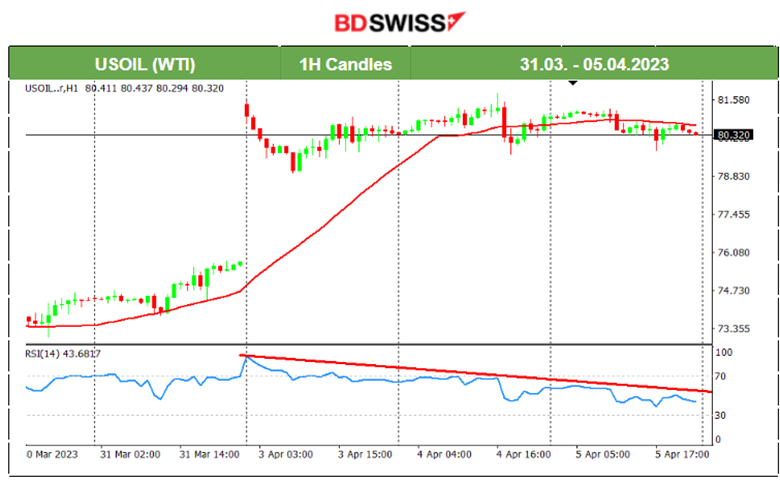
Price trades now near 80.10 USD where it settled after the Organization of Petroleum Exporting Countries (OPEC) and its allies shocked the market with a surprise supply cut, causing the price to jump near 6 dollars on the 3rd of April.
US crude inventories change was negative with -3.7 million barrels change last week, which was less than expected.
“The rally in crude is likely to be contained in the face of soft economic readings,” said Rebecca Babin, a senior energy trader at CIBC Private Wealth.
Source: https://www.bloomberg.com/news/articles/2023-04-05/oil-extends-rally-as-investors-shift-focus-to-lower-inventories?leadSource=uverify%20wall
______________________________________________________________________
Summary Daily Moves – Winners vs Losers (05 April 2023)

______________________________________________________________________
News Reports Monitor – Previous Trading Day (05 April 2023)
Server Time / Timezone EEST (UTC+03:00)
- Midnight – Night Session (Asian)
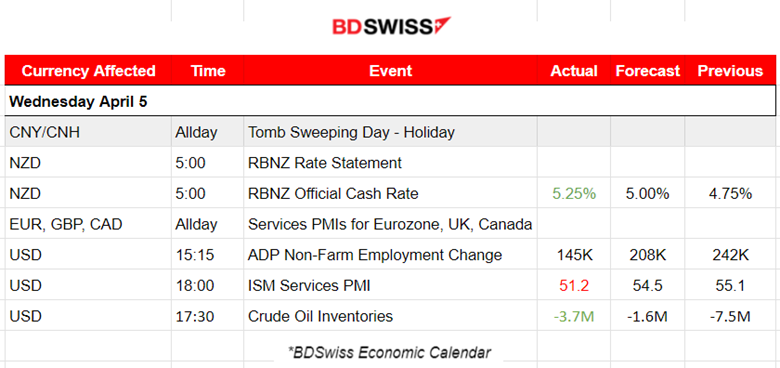
At 5:00 the RBNZ Official Rate figure was released and it was higher than expected by 50 basis points, from 4.75% to 5.25%. The Committee agreed that the rate must be increased to return inflation to the 1-35 target range over the medium term. This unexpectedly higher figure led to NZD appreciation. The NZDUSD jumped over 70 pips before it retraced back to 61.8% of the total sharp move upwards soon and even went lower later in the day.
- Morning – Day Session (European)
Services PMIs were released as per the below report:
The Eurozone Services PMIs show an overall expansion and increased business activity. All of the eurozone nations covered by the PMI survey (which combined, account for around 78% of private sector output across the area) recorded greater activity levels when compared to February. Spain was by far the top-performing country in March with a PMI index of 59.4.
At 11:30 the UK Services PMI was released. UK service providers reported a sustained expansion of business activity during March. The index is currently 52.9, not far from the expected previous one.
At 17:00 the US ISM Services PMI was released. Economic activity in the services sector expanded in March for the third consecutive month as the Services PMI® registered 51.2% according to the purchasing and supply executives in the latest Services ISM® Report On Business®.

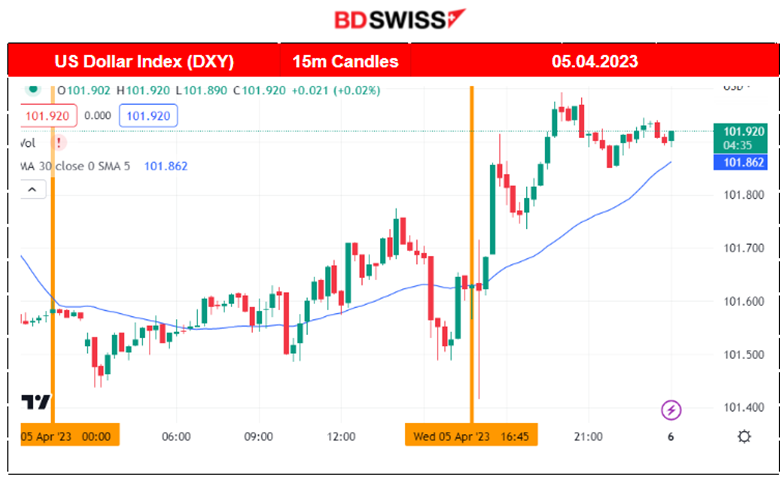
ADP Non-Farm Employment Change figure was released at 15:15. Private Sector Employment increased by 145K jobs in March according to the March ADP® National Employment Report™ produced by the ADP Research Institute® in collaboration with the Stanford Digital Economy Lab (“Stanford Lab”). The data show that US companies added fewer jobs compared to the higher forecast of 208K and lower than the previous change.
The impact on the USD caused the currency to depreciate as shown on the DXY chart. The index at that time crosses and moves below the MA. Later it retraces back to the mean.
General Verdict:
______________________________________________________________________
FOREX MARKETS MONITOR
EURUSD 4-Day Chart Summary
Server Time / Timezone EEST (UTC+03:00)
Price Movement
EURUSD is moving generally higher, experiencing high volatility. The last couple of days we had reversals one on the 3rd of April and another yesterday 5th of April. The Intraday shocks caused by the USD-related figures are the main drivers of the EURUSD path.

EURUSD (05.04.2023) Chart Summary
Server Time / Timezone EEST (UTC+03:00)
Price Movement
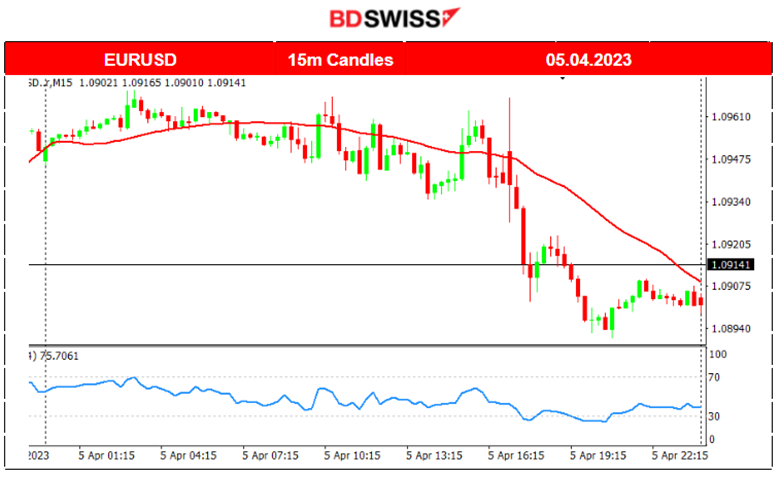
The pair was experiencing low volatility during the Asian Session but that changed, even though not significantly, when it moved to the European. The market was expecting the important US private sector employment change figure at 17:00. At that time the released report caused a shock and a drop to the pair as the USD started to show appreciation for the rest of the trading day.
NZDUSD 4-Day Chart Summary
Server Time / Timezone EEST (UTC+03:00)
Price Movement
NZDUSD has been experiencing low volatility in general with signs that it is following an upward short trend. It is moving mainly from the USD news though like most majors. A significant reversal was observed on the 3rd of April crossing the 30-period MA and moving upwards. The important RBNZ Official Cash Rate figure released on the 5th of April caused the pair to jump but reverse completely later during the day.

NZDUSD (05.04.2023) Chart Summary
Server Time / Timezone EEST (UTC+03:00)
Price Movement
The pair’s price path yesterday was quite volatile starting from the Asian session due to the RBNZ rate. However, the pair moved generally sideways and around the 30-period MA.
Trading Opportunities
After the important figure release and the shock that followed a retracement was expected. Due to the rapid movement of the price at that time, it is difficult to find evidence that the movement really ended at some point. It is risky to assume that a retracement will occur. Traders could better focus on the reversals and the retracement opportunities that follow. On the chart, we see how the Fibonacci expansion tool is used to identify the retracement 61.8% level.

____________________________________________________________________
EQUITY MARKETS MONITOR
NAS100 (NASDAQ – NDX) 4-Day Chart Summary
Server Time / Timezone EEST (UTC+03:00)
Price Movement
A clear upward trend was visible in recent days as a risk-on mood was governing Wall Street. Nevertheless, in the last couple of days, things have changed with US Stocks showing signals that the upward move has ended, with no clear signs of reversal. A head and shoulders pattern is visible with neckline support levels near 13050 USD level. The RSI has lower highs while the price has higher highs in this chart indicating that reversal is more possible. On the 5th April the price breaks the neckline, thus moving lower completing the pattern.

NAS100 (05.04.2023) Chart Summary
Server Time / Timezone EEST (UTC+03:00)
Price Movement
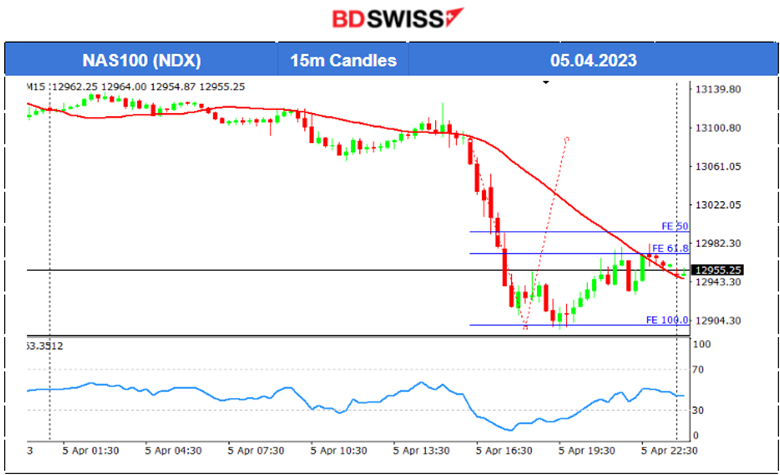
The index moved with low volatility during the Asian session slightly downwards below the 30-period MA. A shock after the NYSE opening caused the index to drop. The drop was further boosted by the brakes of significant support levels near 13050 USD that can be visible from another higher timeframe.
Trading Opportunities
The index drop after the NYSE opening deviates significantly from the MA. Retracement is expected. The Fibo 61.8% level is identified with the Fibonacci expansion tool as per the chart.
______________________________________________________________________
COMMODITIES MARKETS MONITOR
USOIL (WTI) 4-Day Chart Summary
Server Time / Timezone EEST (UTC+03:00)
Price Movement
Crude jumped with the OPEC+ announcement for production cuts with the market opening higher on the 3rd of April. Since then the price of oil continued its steady sideways movement around the mean with no significant deviations from the MA. The RSI indicates signals of price stability with lower highs as we approach the 5th April.
USOIL (WTI) (05.04.2023) Chart Summary
Server Time / Timezone EEST (UTC+03:00)
Price Movement
The price moves significantly during the European Markets opening downwards and continues with a steady movement below the 30-period MA. A price reversal at 17:30 takes place with the price moving upwards and crossing the MA. Price found resistance at 80.80 USD level and retraced back.
Trading Opportunities
The Crude’s price deviates from the MA significantly but only after a reversal can we have a good indication of a potential retracement. In addition, The RSI indicates a bullish divergence: RSI: Higher Lows, Price: Lower Lows.

______________________________________________________________
News Reports Monitor – Today Trading Day (06 April 2023)
Server Time / Timezone EEST (UTC+03:00)

- Midnight – Night Session (Asian)
No significant news. No important scheduled releases.
- Morning – Day Session (European)
At 15:30 we have many important figures to be released affecting both the CAD and the USD. Canada Employment change and unemployment change announcements are about to have an impact on the currencies and create an intraday shock on the CAD pairs. Same for the USD especially if the US Unemployment claims are way over the expected 200K figure.
Canada’s Unemployment rate is expected to be reported higher than the previous and of course the employment change for March to be lower. USDCAD will deviate significantly at that time if the two currencies are affected differently by these reports.
General Verdict:
- We are expecting low volatility for CAD pairs before the news but not so low for the USD. Intraday shocks during the announcements are almost certain with high probability of big deviation from the mean and retracements to follow after.
______________________________________________________________


