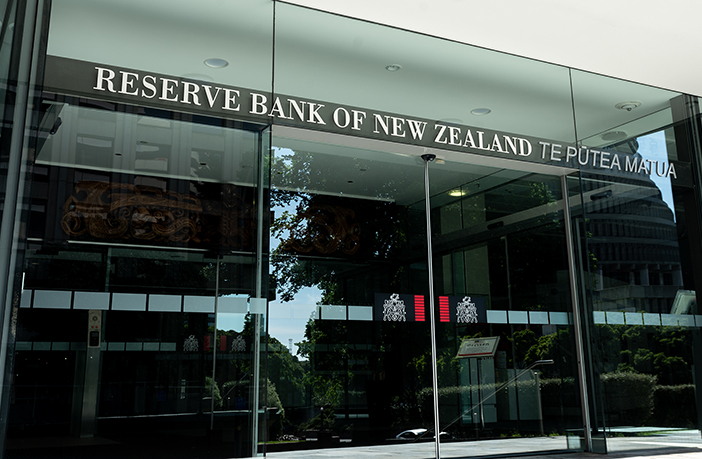
Previous Trading Day’s Events (10.07.2024)
“The Committee agreed that monetary policy will need to remain restrictive. The extent of this restraint will be tempered over time consistent with the expected decline in inflation pressures,” the statement said.
The RBNZ said it expected headline inflation to return within the 1% to 3% target range in the second half of this year, down from 4% in the first quarter.
The rate hikes have sharply slowed the economy, although recent data showed New Zealand moved out of a technical recession in the first quarter of 2024 with growth of 0.2%.
______________________________________________________________________
Winners vs Losers
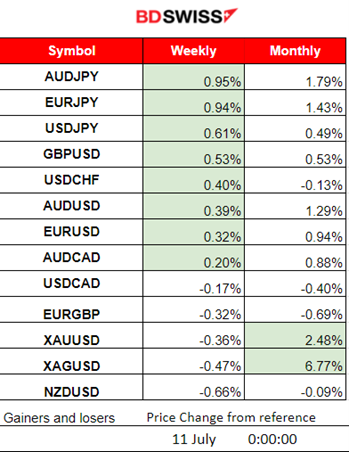
JPY pairs lead this week (JPY as Quote) AUDJPY is on the top with 0.95% gains so far. The USD remained stable. Silver leads this month with 6.77% gains.
 ______________________________________________________________________
News Reports Monitor – Previous Trading Day (10.07.2024)
Server Time / Timezone EEST (UTC+03:00)
- Midnight – Night Session (Asian)
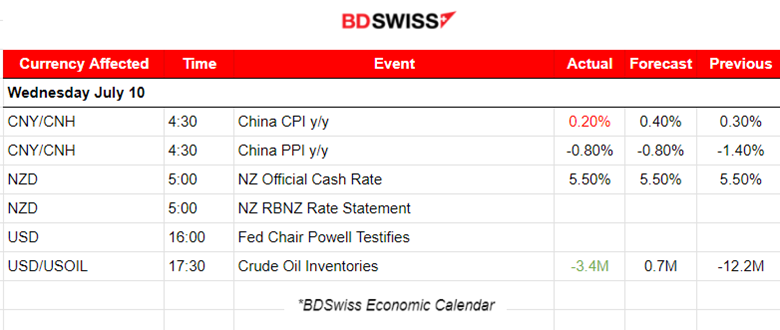
China’s inflation was reported to be weak, falling to 0.20% on a yearly basis. Weak domestic demand is the reason. No major impact on the market was recorded.
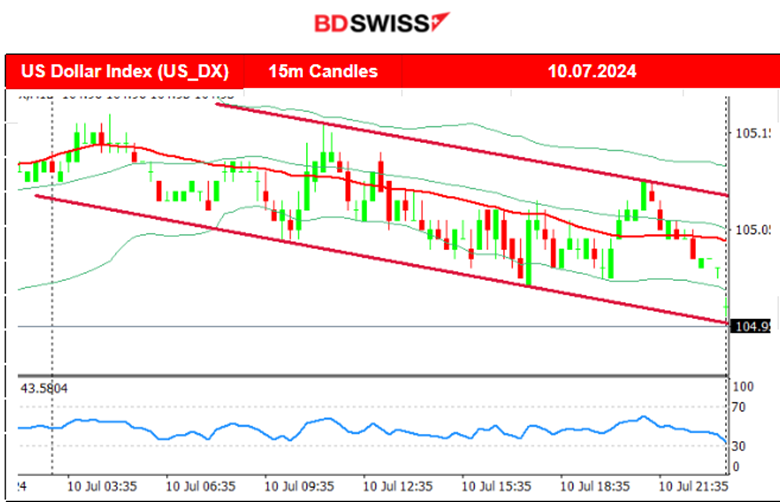
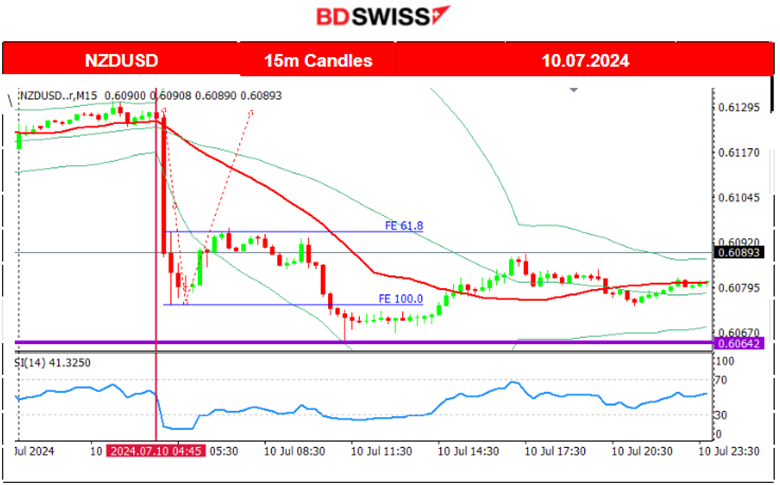
The RBNZ decided to keep rates steady causing the NZD to depreciate significantly. An intraday shock was recorded that caused the NZDUSD to drop nearly 50 pips before a retracement took place. The drop though continued to take place.
- Morning – Day Session (European and N. American Session)
No important news announcements, no important scheduled releases.
General Verdict:
 __________________________________________________________________
FOREX MARKETS MONITOR
EURUSD (10.07.2024) 15m Chart Summary
Server Time / Timezone EEST (UTC+03:00)
Price Movement
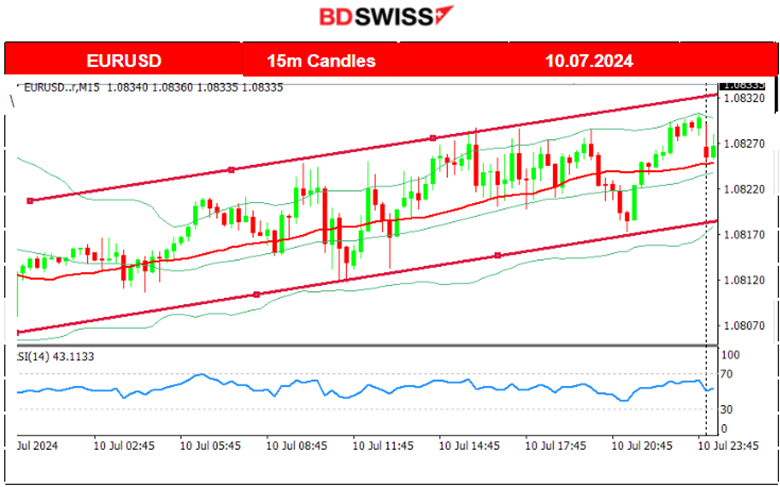
The pair moved steadily to the upside as the USD was experiencing depreciation. There is a clear intraday upward trend with the price moving around the MA. No major volatility was recorded due to the absence of significant scheduled releases.
 NZDUSD (10.07.2024) 15m Chart Summary
Server Time / Timezone EEST (UTC+03:00)
Price Movement
RBNZ Kept rates steady yesterday, however the impact was huge. At 17:00 the NZD suffered depreciation causing the pair to drop nearly 50 pips before retracing to the 61.8 Fibo level. A further downward movement took place until it eventually found strong support at near 0.60640. Intraday retracement followed reversing back to the 30-period MA and moving sideways around it until the end of the trading day.
 ___________________________________________________________________
CRYPTO MARKETS MONITOR
BTCUSD (Bitcoin) Chart Summary 1H
Server Time / Timezone EEST (UTC+03:00)
Price Movement
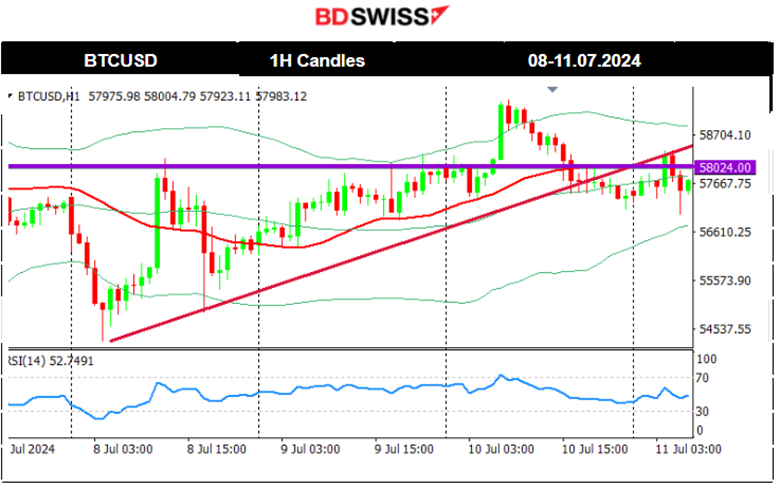
On the 5th of July, the price fell further breaking the 57K USD level and dropped to the next support at 54K USD. Since then the market recovered and corrected by moving upwards and crossing the 30-period MA. The price remained close to the MA as it continued moving sideways with a clear mean level at nearly 57K USD. The latest price data formed a triangle indicating that volatility levels lowered and as mentioned in our previous analysis upon triangle breakout on the 10th it led to a jump. Now the price remains higher, settling at the suggested mean near 58K USD.
 Crypto sorted by Highest Market Cap:
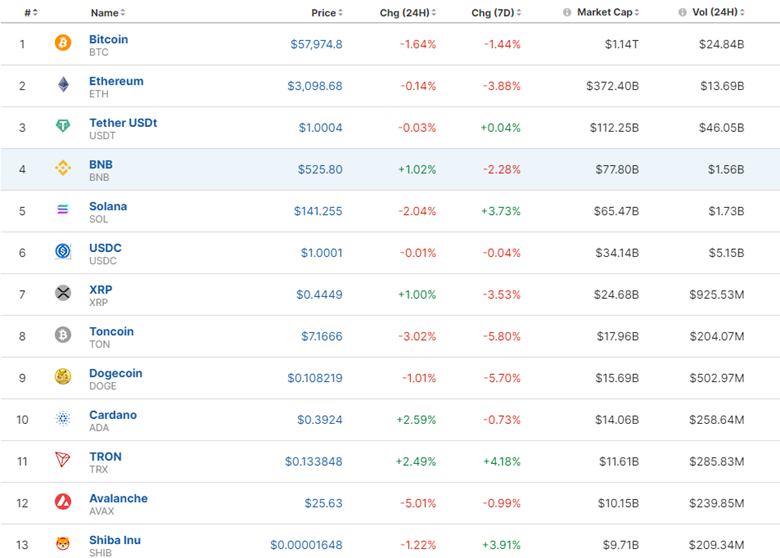
Most Crypto suffered losses lately. The last few days however we see some correction, eliminating some of the losses. No significant correction has taken place so far.
https://www.investing.com/crypto/currencies
______________________________________________________________________
EQUITY MARKETS MONITOR
S&P500 (SPX500) 4-Day Chart Summary
Server Time / Timezone EEST (UTC+03:00)
Price Movement
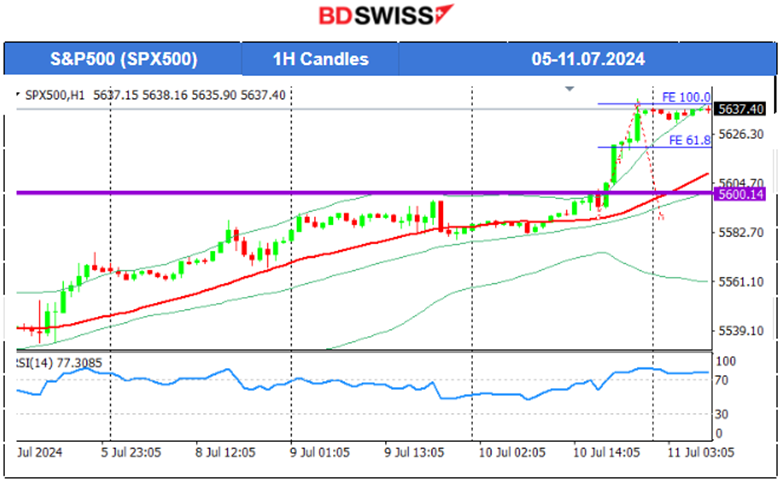
This week started with a more aggressive upward movement for the index. Looking at things from afar, no significant correction is expected yet. A clear uptrend. The RSI is indeed showing bearish signals. That however must be supported with downside breakouts and that did not happen yet. Instead, U.S. stocks got a boost yesterday, ahead of the U.S. inflation report, remaining on the uptrend that started on July 2nd. There is a chance that the CPI inflation y/y figure will not be reported as expected and a huge index drop will take place. This will be surprising since the economic conditions in the U.S. are showing signs of deterioration. Expectations about lowered borrowing costs starting in September are boosting investment in stocks. Will this risk-on mood continue though? A disappointing inflation figure might turn things around.
 ______________________________________________________________________
COMMODITIES MARKETS MONITOR
USOIL (WTI) 4-Day Chart Summary
Server Time / Timezone EEST (UTC+03:00)
Price Movement
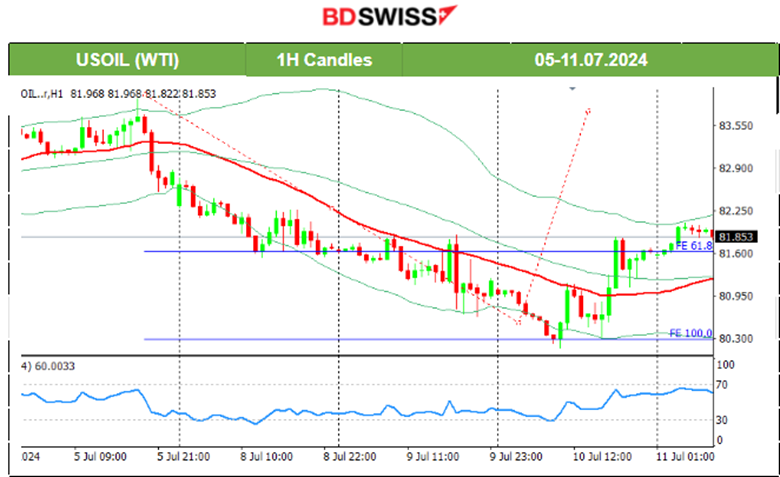
A triangle formation was formed and on the 5th of July after 18:00 server time, the price dropped heavily breaking that triangle to the downside. The fall extended to the support near 81.5 USD/b and then retraced to the 61.8 Fibo level before it started to test that support again. As mentioned in the previous analysis, there was a potential for a breakout and a further downward movement of Crude oil’s price. This breakout took place and was extended with a further drop until the 9th of July. The price settled eventually near 80.5 USD/b below the MA, but on the 10th it eventually reversed to the upside. This movement was a correction/retracement to the 61.8 Fibo level as depicted on the chart. The price boost to the upside was a result of a reported decline, -3.4M barrels in Crude Oil Inventories in the U.S. against a forecast of 0.7M growth at 17:30 yesterday
 XAUUSD (Gold) 4-Day Chart Summary
Server Time / Timezone EEST (UTC+03:00)
Price Movement
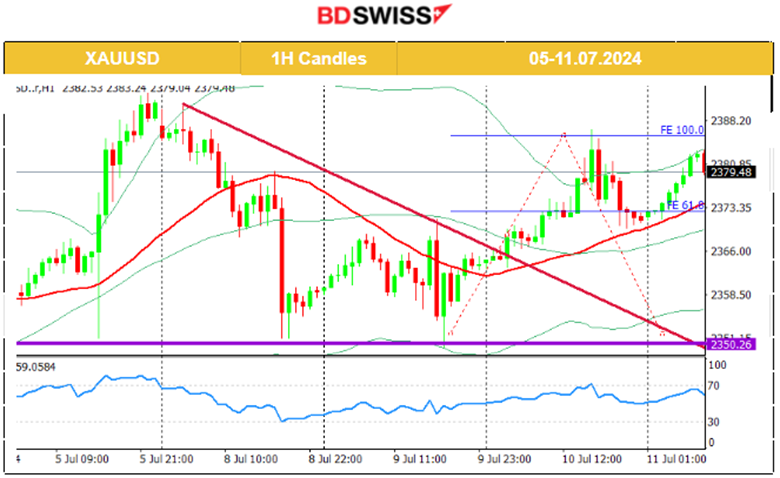
Gold jumped due to the USD’s early depreciation and tested the high at 2,365 USD/oz on the 5th of July. On the same day, it jumped again during the NFP release. It was an intraday shock that resulted in increased demand for metals, pushing Gold upwards to technically complete the breakout of the previous triangle formation and reaching the next target level at nearly 2,393 USD/oz as mentioned in our webinar on Friday. On the 8th it corrected from that jump and moved significantly to the downside. It crossed the 30-period MA and found support at 2,350 USD/oz before it retraced to the MA. After several unsuccessful breakouts of that support, the price eventually moved to the upside on the 9th of July. The target level of 2,380 USD/oz was reached as per our forecast in the previous analysis and the price even moved higher reaching the resistance at 2,387 USD/oz before retracement took place. Today Gold tests that resistance again early.
 ______________________________________________________________
News Reports Monitor – Today Trading Day (11.07.2024)
Server Time / Timezone EEST (UTC+03:00)
- Midnight – Night Session (Asian)
No important news announcements, no important scheduled releases.
- Morning – Day Session (European and N. American Session)
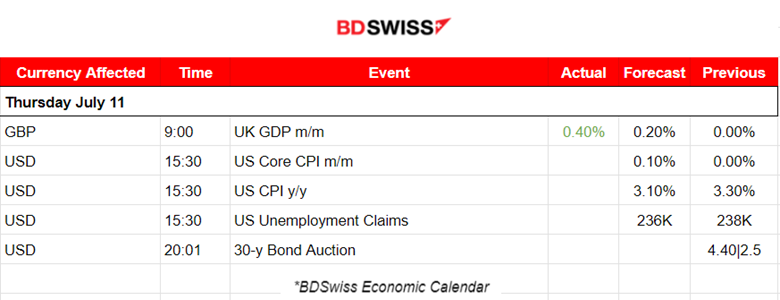
The UK monthly GDP figure released at 9:00 reported growth for the U.K. economy. Monthly real gross domestic product (GDP) is estimated to have grown by 0.4% in May 2024 after showing no growth in April 2024. The GBP appreciated only momentarily. The intraday shock was minimal.
At 15:30 the big news will come out. The highly anticipated U.S. CPI inflation figures will be reported and will potentially shake the markets. If there is a surprise to the upside then the USD is expected to get a boost due to a change in expectations of a rate cut. “A delay will be most likely to happen” will be how the market will perceive it.
General Verdict:
______________________________________________________________


