

Previous Trading Day’s Events (22.05.2024)
Globally, consumer price inflation has declined from 30-year highs in many advanced economies. However, services inflation is receding slowly,
New Zealand’s labour market pressures have cooled. Wage growth and domestic spending are easing to levels more consistent with the Committee’s inflation target.
Source:
https://www.rbnz.govt.nz/monetary-policy/monetary-policy-decisions
Services inflation was much higher than expected, and petrol prices rose. It inched down to 5.9% from 6.0% in March.
“This is only one month’s data, but it is enough of a surprise to suggest that the inflation process is not tracking as the BoE had expected,” Allan Monks, chief UK economist at JP Morgan, said.
“There is still another labour market and CPI report to come before the June meeting, but it is difficult for us to see what that could realistically do to leave most members feeling confident about cutting in June specifically.”
Core inflation, which includes goods but not energy, food and tobacco, also reflected persistent price pressures, with the annual rate falling only to 3.9% from 4.2% in March.
Source:
https://www.reuters.com/world/uk/uk-inflation-rate-slows-23-april-2024-05-22/
______________________________________________________________________
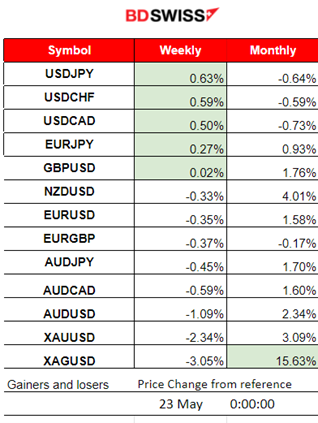
Winners vs Losers
USDJPY and other USD pairs reach the top of the week’s list as the USD gains strength. Metals moved to the bottom of the list after a sudden retreat yesterday.
 ______________________________________________________________________
News Reports Monitor – Previous Trading Day (22.05.2024)
Server Time / Timezone EEST (UTC+03:00)
- Midnight – Night Session (Asian)
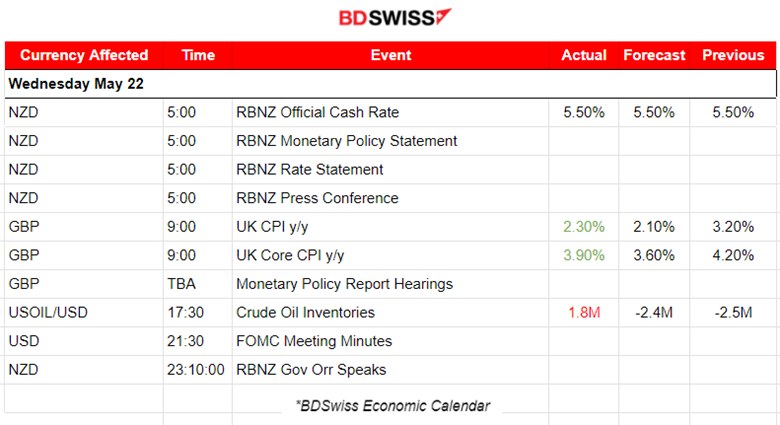
The RBNZ decided to keep interest rates steady. Annual consumer price inflation is expected to return to within the Committee’s 1 to 3 percent target range by the end of 2024. NZD was appreciated heavily at that time. NZDUSD jumped near 50 pips and retracement followed. Statement monetary policy needs to be restricted.
- Morning – Day Session (European and N. American Session)
The Consumer Price Index (CPI) in the U.K. was reported lower but higher than expected. The U.K. which had the highest inflation peak of over 11% has managed to beat the U.S. (currently at 3.4%) by lowering it to 2.3% very close to the target level. The market reacted with GBP appreciation and the GBPUSD jumped 35 pips before retracing to the intraday MA.
While the FOMC’s latest Meeting Minutes didn’t rule out a September rate cut directly, investors are growing nervous. Uncertainty is in the air while inflation is still high in the U.S. while in the other economic regions it has been cooling as expected.
General Verdict:
 __________________________________________________________________
FOREX MARKETS MONITOR
EURUSD (22.05.2024) 15m Chart Summary
Server Time / Timezone EEST (UTC+03:00)
Price Movement
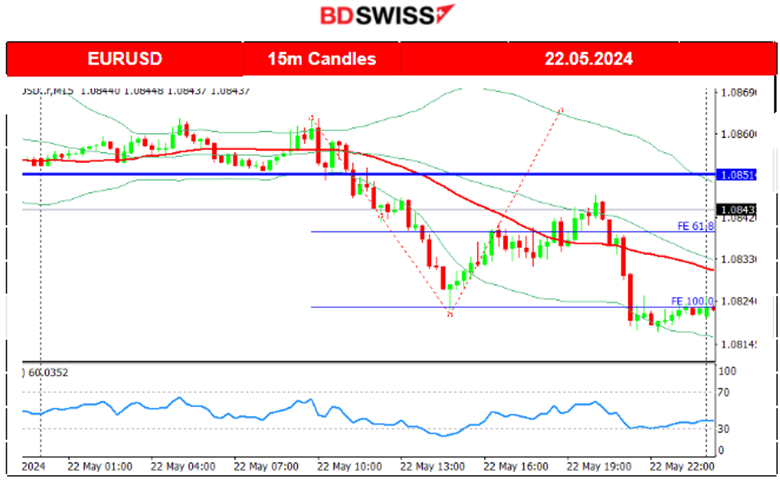
The pair moved to the downside significantly after the start of the European session and since the USD started heavy appreciation. An important support was broken causing the EURUSD to dive and reach the next support at 1.08220 before retracing to the 30-period MA. Another dive happened at 20:15 due to a second dollar appreciation causing a further drop. The Federal Open Market Committee (FOMC) raised concerns for inflation yesterday at 21:00 and that they are determined to wait for more proof that inflation will ease to 2%.
 ___________________________________________________________________
CRYPTO MARKETS MONITOR
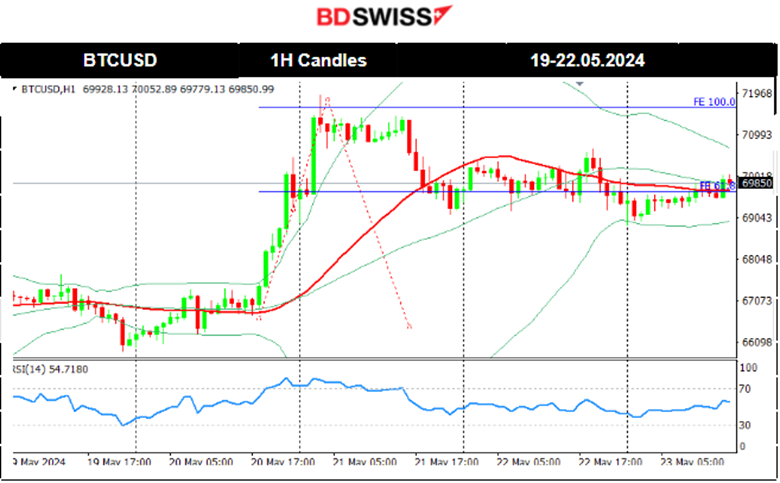
BTCUSD (Bitcoin) Chart Summary 1H
Server Time / Timezone EEST (UTC+03:00)
Price Movement
On the 17th of May, the price eventually moved upwards, crossing over the 67K USD level but remained close. Since that day a consolidation phase took place with the 30-period MA to turn sideways and the mean to remain at 67K USD. The price tested that resistance many times without success.
A jump occurred on the 20th of May with the price reaching 70K as mentioned in our previous analysis. It actually saw a further increase today with the price reaching a peak at 72K. Retracement also took place as expected and mentioned in our previous analysis back to the MA. Bitcoin settled near 70K USD and is stable for now.
 Crypto sorted by Highest Market Cap:
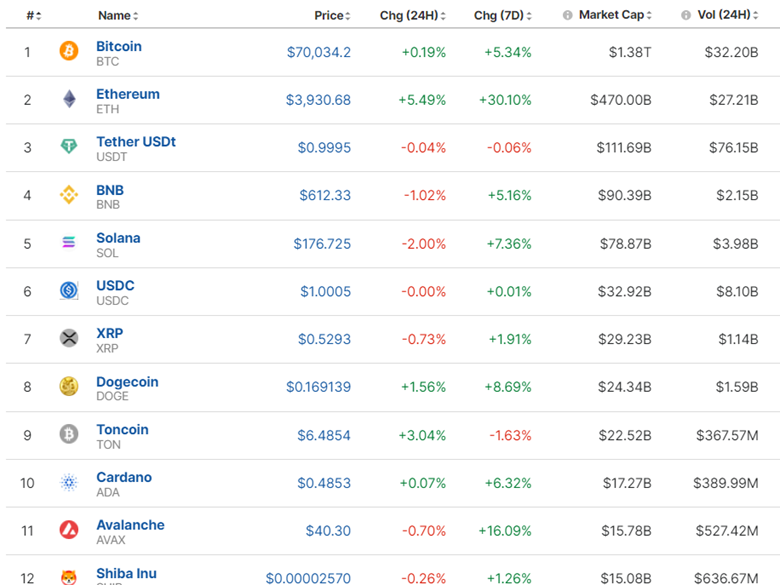
The market is stable and holds the gains generated after the boost on the 20th.
Source: https://www.investing.com/crypto/currencies
______________________________________________________________________
EQUITY MARKETS MONITOR
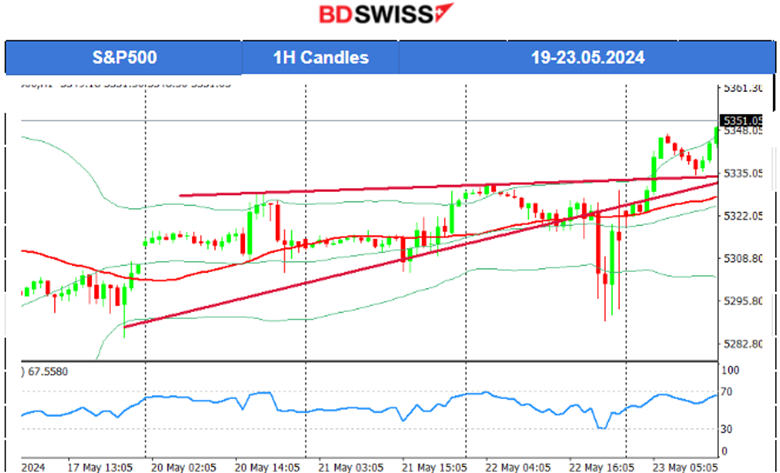
S&P500 (SPX500) 4-Day Chart Summary
Server Time / Timezone EEST (UTC+03:00)
Price Movement
On the 17th of May, the index moved with low volatility on the sideways and around the MA with a mean of 5,300 USD. On the 20th of May, the index saw a very volatile start to the stock market session moving to the upside, however, it reversed later rapidly back to the intraday MA and closed flat. We experienced mixed price path data for U.S. indices on the 20th of May. Very strange and rare to look at all three indices closing the sessions in 3 different directions. NAS100 jumped and closed higher while the SPX500 closed flat after a similar volatile session. US30 (Dow Jones) dropped instead. On the 21st of May, the index remained high and moved to the upside testing the highs for the 3rd time without success. The triangle formation that was highlighted in our previous analysis was broken on the 22nd of May and the index moved downwards to the support near 5,290 USD before a full reversal took place. This high volatility depicted on the chart was taking place during the FOMC meeting minutes release. Currently all U.S. indices experience a pre-market aggressive movement to the upside.
 ______________________________________________________________________
COMMODITIES MARKETS MONITOR
USOIL (WTI) 4-Day Chart Summary
Server Time / Timezone EEST (UTC+03:00)
Price Movement
After the news on the 16th of May, Crude oil started a steady path to the upside remaining above the MA. As mentioned in our previous analysis, the path looked like an upward wedge, if not a channel, that the price followed as it moved to the upside and a potential opportunity to trade upon breakout was taking place. The price eventually experienced a breakout to the downside moving away from the wedge and indicating the end of the uptrend. On the 21st of May, the price stayed below the 30-period MA and moved even lower today forming lower lows. The bullish divergence was valid as mentioned in our previous analysis. The price eventually jumped on the 23rd of May crossing the 30-period MA on its way up and indicating the possible end of the downtrend.
 XAUUSD (Gold) 4-Day Chart Summary
Server Time / Timezone EEST (UTC+03:00)
Price Movement
On the 20th the price continued with an upward and rapid movement but after reaching the peak of 2,450 USD/oz and in an overbought territory, the market decided to sell. The 61.8 Fibo level was reached as the price returned to the 2,400 USD/oz level. A triangle formation indicated the important support at 2,400 USD/oz and the potential to move to the downside upon breakout, to the 2,380 USD/oz level. Gold has however shown great potential for an upside movement and trend with a potential to break the triangle to the upside instead and test again that 2,450 USD/oz level in the future. The support on the 22nd of May was broken and the price dropped heavily reaching the support at near 2,355 USD/oz. Retracement has not taken place fully.
 ______________________________________________________________
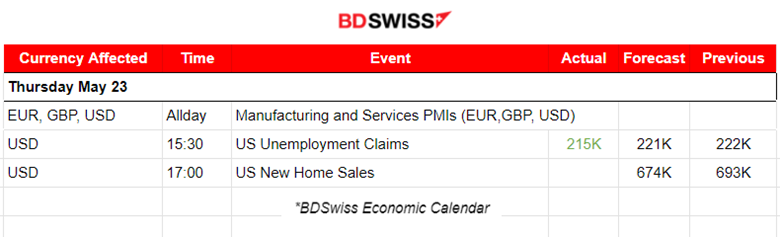
News Reports Monitor – Today Trading Day (23 April 2024)
Server Time / Timezone EEST (UTC+03:00)
- Midnight – Night Session (Asian)
No important news, no special scheduled figure releases.
- Morning – Day Session (European and N. American Session)
The PMIs have some impact on the EUR since in general the Eurozone PMIs were improved. The dollar weakens. U.K. PMIs do not improve in services and the GBP gains against the dollar as well.
At 15:30 the Unemployment claims figure was reported lower at 215K showing that the labour market can potentially get hotter again.
General Verdict:
______________________________________________________________


