Previous Trading Day’s Events (06 Feb 2024)
“While recent data indicate that inflation is easing, it remains high… The Board needs to be confident that inflation is moving sustainably towards the target range,” said the RBA Board in a statement.
“Fourth-quarter figures confirmed that the exceptionally tight NZ labour market is only slowly going off the boil,” ASB Bank Senior Economist Mark Smith said in a note.
ASB Bank expects unemployment to continue its upward journey, but it may not rise by as much as earlier expected, while wage inflation may not moderate as quickly as expected earlier, he added.
Source: https://www.reuters.com/markets/new-zealands-jobless-rate-rises-40-fourth-quarter-2024-02-06/
______________________________________________________________________
Winners vs Losers
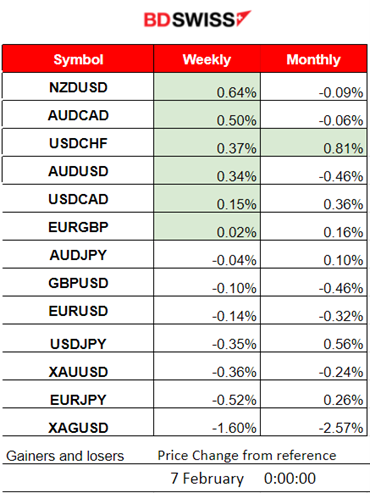
NZDUSD is on the top of the winner’s list for the week with 0.64% gains so far. Yesterday’s labour market-related data was positive for the NZD currency, while the dollar experienced weakness. USDCHF is the month’s top gainer so far with 0.81% performance.
 ______________________________________________________________________
News Reports Monitor – Previous Trading Day (06 Feb 2024)
Server Time / Timezone EEST (UTC+02:00)
- Midnight – Night Session (Asian)
No important news announcements, no special scheduled releases.
- Morning–Day Session (European and N. American Session)
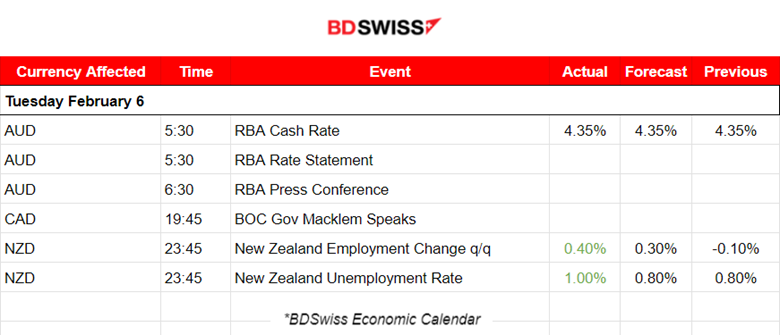
RBA decided to leave the cash rate target unchanged at 4.35%. The Board stated that inflation continued to ease in the December quarter. Despite this progress, inflation remains high at 4.1%. The market reacted with a low-impact intraday shock that caused some AUD appreciation. The AUDUSD only jumped around 20 pips at that time.
New Zealand’s employment data were released at 23:45 and showed that the employment change for the December quarter increased by 0.4% beating expectations. The quarterly unemployment rate was reported higher despite the employment increase. The stronger-than-expected labour market figures will need to be taken seriously into account by the Reserve Bank of New Zealand (RBNZ) since a greater-than-expected easing in consumer price inflation might be needed. The RBNZ probably will be much less inclined towards interest rate cuts this year than what the market is currently pricing. The market reacted with strong NZD appreciation at the time of the releases. The NZDUSD jumped
General Verdict:
 ____________________________________________________________________
FOREX MARKETS MONITOR
NZDUSD (06.02.2024) 15m Chart Summary
Server Time / Timezone EEST (UTC+02:00)
Price Movement
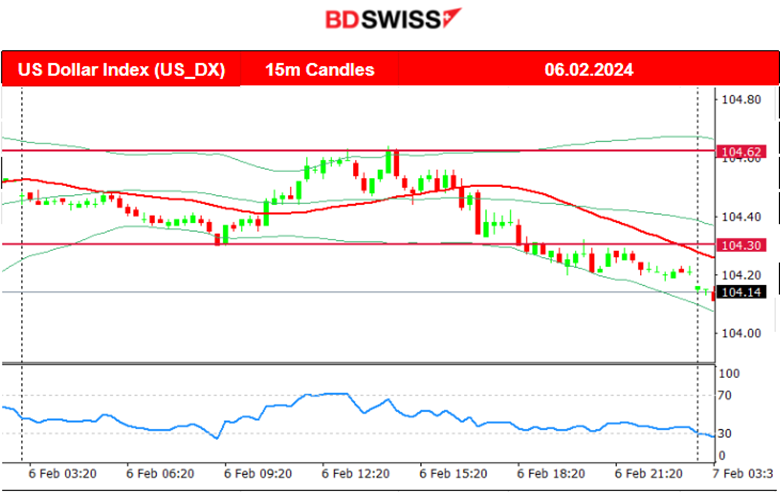
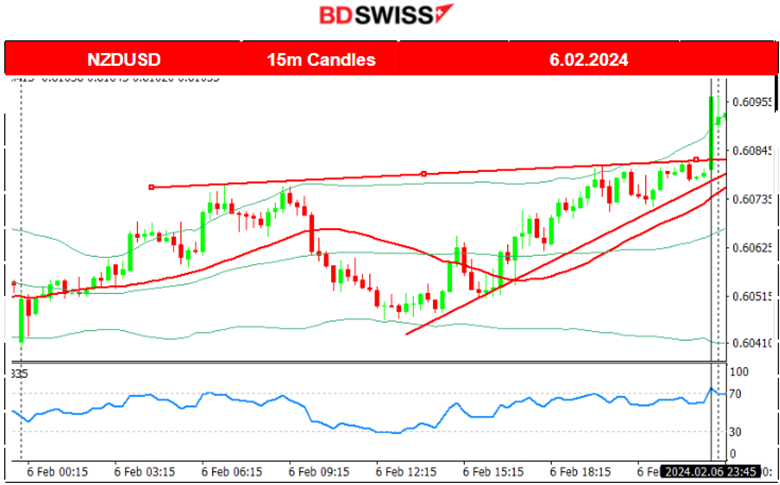
The pair started early to climb, reaching the resistance at 0.60760 and reversing to the downside near the start of the European session. It crossed the 30-period MA on the way down reaching the support at 060460 before reversing again to the downside. It then followed an upward steady path until the news at 23:45. It is clear that the dollar index chart is a mirror of the path indicating that the USD was the main driver until this point. Then at 23:45, the NZD currency experienced strong appreciation due to the positive labour market news. The pair’s jump was not so great at that time, 15 pips, however, the effect continued to the next trading day, so the pair moved steadily higher soon after.
 ___________________________________________________________________
CRYPTO MARKETS MONITOR
BTCUSD (Bitcoin) Chart Summary 1H Timeframe
Server Time / Timezone EEST (UTC+02:00)
Price Movement
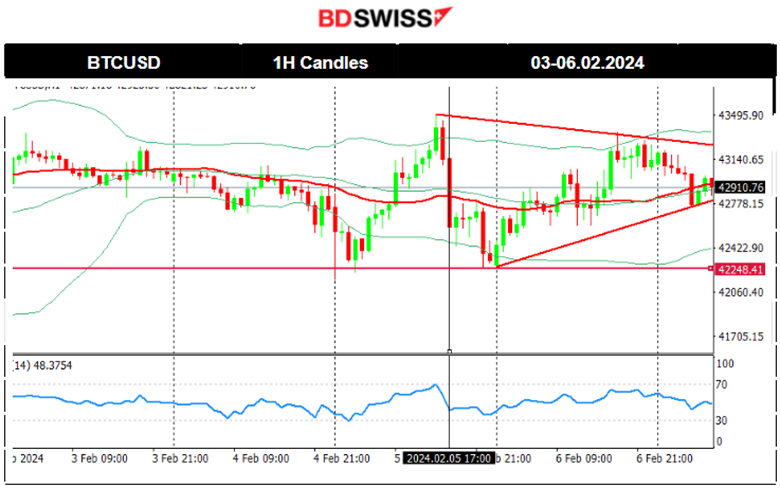
Bitcoin faced a shock during the NFP report release on Friday but closed near flat for the trading day. Volatility levels lowered after that event and a triangle was formed during the weekend. On Sunday, 4th Feb, the price broke the triangle to the downside reaching the support at 42,200 USD. It soon reversed after that, crossing the 30-period MA on its way to the upside and settling near 43,000 USD. On the 5th Feb, it quickly climbed to find the resistance at near 43,500 USD before reversing again quite rapidly and crossing the 30-period MA on its way back, closing the day lower at the support near 42,250 USD. On the 6th Feb, it moved upwards steadily finding resistance at near 43,360 USD before reversing to the mean. A triangle was formed as volatility levels seemed to lower. At which side will the triangle break is the next question.
 Crypto sorted by Highest Market Cap:
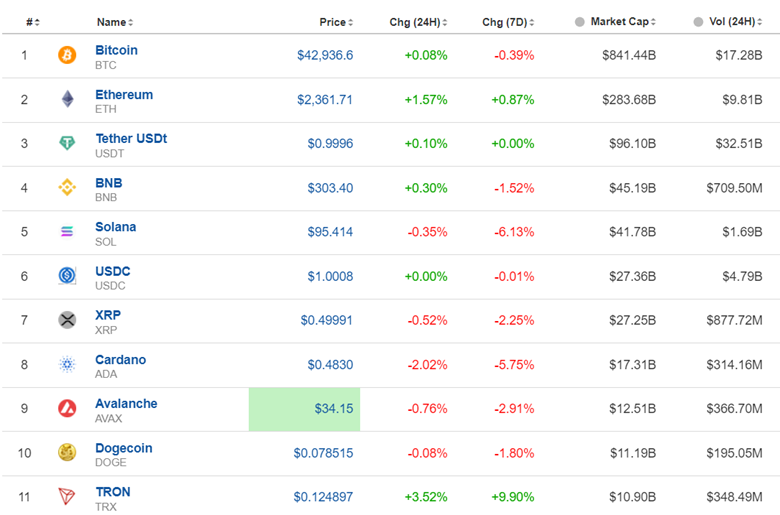
The path remains sideways. Taking into account only a 7-day period, the market faces losses for now, however, it remains stable generally and no major movement has been recorded yet. With volatility levels lowering currently, the probability of seeing large movements soon gets higher.
Source: https://www.investing.com/crypto/currencies
______________________________________________________________________
EQUITY MARKETS MONITOR
NAS100 (NDX) 4-Day Chart Summary
Server Time / Timezone EEST (UTC+02:00)
Price Movement
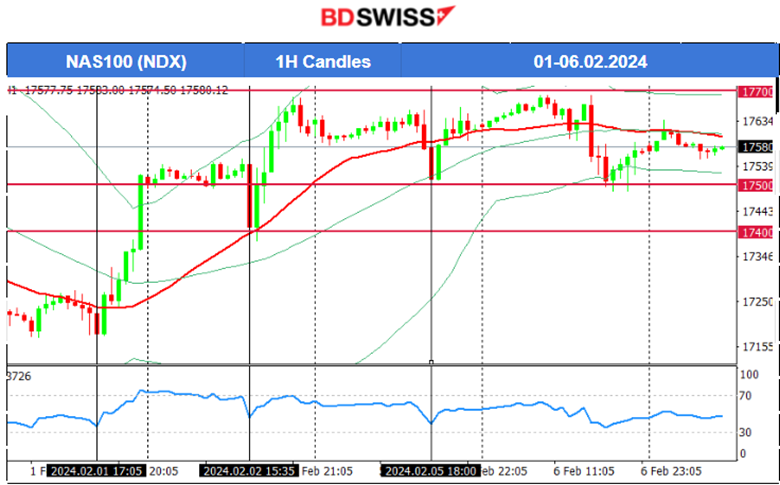
On the 2nd Feb, the NFP news at 15:30 caused an intraday shock that brought the U.S. indices down to lower levels for some time. NAS100 reached support near 17,400 USD before a huge reversal took place. The index reversed, crossing the 30-period MA on the way up and reached the resistance higher at near 17,700 USD before retracing. The RSI was signalling a bearish divergence, as mentioned in our previous analysis, and on the 5th Feb, the index eventually dropped heavily to the next support at near 17,500 USD before reversing back to the mean. On the 6th Feb, the index did not manage to break the resistance at near 17,700 USD and a reversal again followed back to the support at near 17,500 USD. Another reversal sent the index back to the mean. A clear consolidation phase that keeps the index on the sideways, however experiencing high volatility on the way.
 ______________________________________________________________________
COMMODITIES MARKETS MONITOR
USOIL (WTI) 4-Day Chart Summary
Server Time / Timezone EEST (UTC+02:00)
Price Movement
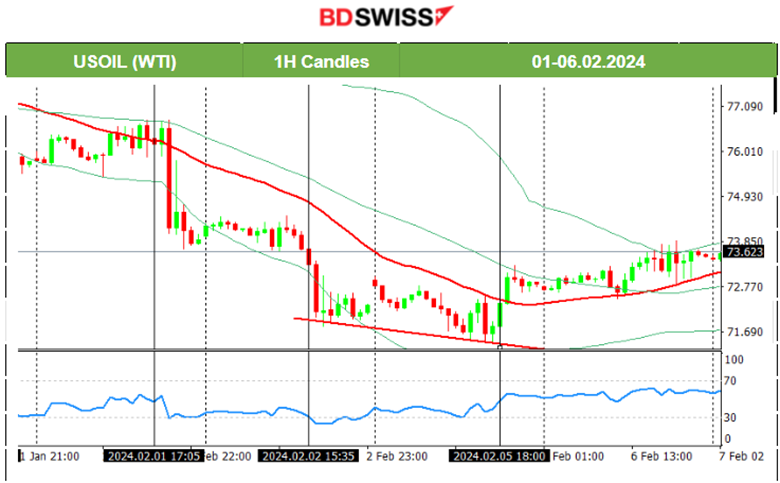
Crude’s price reversed from the downtrend following the RSI’s signals of bullish divergence, as mentioned in the previous analysis. After it reached 74.5 USD/b on the 5th Feb, it reversed to the upside, crossing the 30-period MA on the way up and finding resistance at near 73.2 USD/b before retracing. On the 6th Feb, the price moved steadily upwards while being above the 30-period MA. This indicates a short-term upward trend and the RSI does not signal any halt soon.
 XAUUSD (Gold) 4-Day Chart Summary
Server Time / Timezone EEST (UTC+02:00)
Price Movement
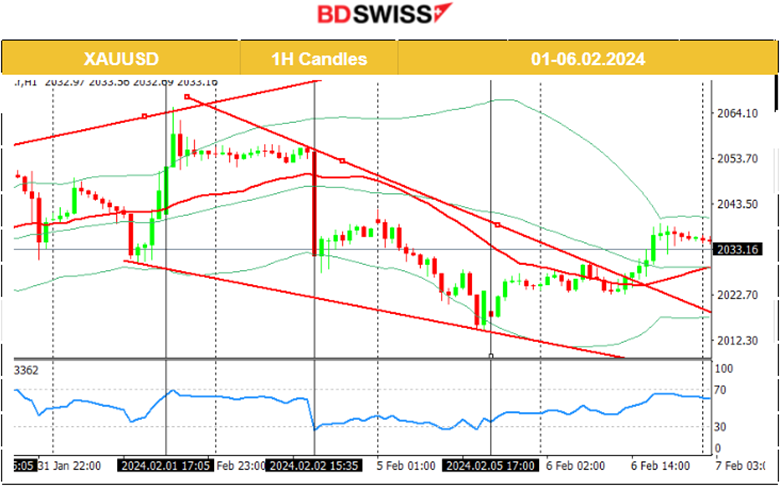
The market shook on the 2nd Feb, at the release of the NFP news. Gold dropped heavily around 28 USD, found support and soon after it retraced to the 61.8 Fibo level. Obviously, the drop was attributed to USD strengthening and the effect could possibly continue for longer. Gold, on the 5th Feb, broke the 2030 USD/oz support moving lower, reaching the support near 2015 USD/oz. Retracement followed and the price returned back to the 61.8 Fibo, settling at near 2025 USD/oz. The 6th of Feb was a good day for Gold as it moved to the upside and remained higher for the trading day, closing at near 2035 USD/oz.
 ______________________________________________________________
News Reports Monitor – Today Trading Day (07 Feb 2024)
Server Time / Timezone EEST (UTC+02:00)
- Midnight – Night Session (Asian)
No important news announcements, no special scheduled releases.
- Morning–Day Session (European and N. American Session)
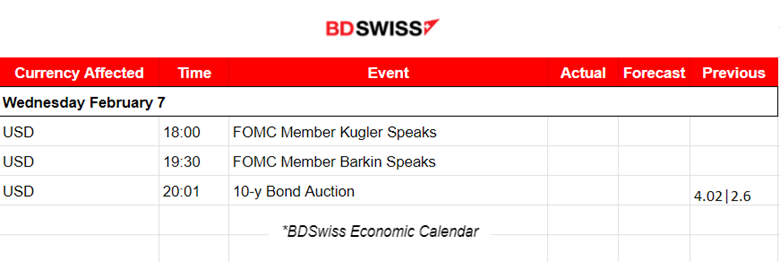
No important news announcements, no special scheduled releases. Statements from FOMC members are scheduled to take place during the trading day after the start of the N. American session. Subject: economic outlook and monetary policy. During that time the USD could be affected moderately, seeing more volatility.
General Verdict:
______________________________________________________________


