


As we begin a new month and the third quarter of the year, it’s beneficial to review the second quarter to prepare for what’s ahead. This article offers a comprehensive analysis of both the US Dollar’s and Japanese Yen’s performance from April to June 2024, examining mixed economic indicators such as GDP growth, unemployment rates, inflation, monetary policy, and trade balance. Additionally, it delves into the technical movements of the US Dollar Index (DXY) and the Japanese Yen Index (JXY), exploring factors influencing the strength and market sentiment of both currencies during the second quarter.
Economic Indicators
GDP

US GDP Growth:
Advance GDP q/q (Apr 25, 2024): 1.6% below forecast (2.4%).
Prelim GDP q/q (May 30, 2024): 1.3% above forecast (1.2%).
Final GDP q/q (Jun 27, 2024): Met forecast (1.4%).
Japan GDP growth:
Preliminary Q1 GDP (May 15): -0.5% (forecast: -0.3%)
Final Q1 GDP (June 9): -0.5%
Impact:
In the second quarter, US GDP growth data presented a varied picture. The Advance GDP q/q released on April 25, 2024, fell short of expectations by 1.6%, impacting market sentiment negatively on the US dollar, but the subsequent Prelim GDP q/q on May 30, 2024, exceeded forecasts by 1.3%, stabilizing perceptions. By the Final GDP q/q release on June 27, 2024, meeting expectations at 1.4%, the US dollar experienced steadier trading conditions as markets adjusted to the economic outlook.
Meanwhile, Japan’s Q2 GDP contraction of -0.5%, as indicated by both preliminary and final figures, highlights economic challenges worse than the forecasted -0.3%, potentially exerting downward pressure on the Japanese Yen.
Unemployment Rate 
US Unemployment Rate:
April : 3.8% (forecast 3.9%)
May : 3.9% (forecast 3.8%)
June : 4.0% (forecast 3.9%)
Japan Unemployment rate:
April: 2.6% (forecast: 2.6%)
May: 2.6% (forecast: 2.6%)
June: 2.6% (forecast: 2.6%)
Impact:
In the second quarter, the US unemployment rate fluctuated slightly above forecasts: it started at 3.8% in April, slightly exceeding the 3.9% forecast, rose to 3.9% in May, just below the 3.8% expected, and further increased to 4.0% in June, surpassing the 3.9% forecast. These variations in unemployment data likely influenced market perceptions of economic strength, impacting the US dollar accordingly. Conversely, the stable unemployment rate of 2.6% from April to June, in line with forecasts each month, suggested a consistent labor market in Japan. This stability could have supported consumer confidence and economic resilience, potentially reinforcing the Japanese Yen amid global economic uncertainties.
Inflation

US Inflation (CPI ):
April 10: 0.4% (forecast 0.3%)
May 15: 0.3% (forecast 0.4%)
June 12: 0.0% (forecast 0.1%)
Japan Inflation ( CPI ) :
Tokyo Core CPI y/y on April 25: -1.6% below the 2.2% forecast.
Tokyo Core CPI y/y on April 25: +1.9% met the forecast.
Tokyo Core CPI y/y on June 27: -2.1% below the 2.0% forecast.
Impact:
The US Dollar reacted diversely to inflation data: April’s CPI surpassed expectations, potentially bolstering the dollar, while lower-than-expected CPI figures in May and June likely tempered dollar strength amidst revised market forecasts. Conversely, the Japanese Yen faced potential downward pressure from April and June’s inflation readings, which fell well below forecasts, hinting at economic difficulties and influencing market confidence in the yen’s stability.
Monitory Policy 
In the second quarter, the Federal Reserve maintained the Federal Funds Rate at 5.5%, consistent with market expectations and contributing to stability in the US dollar. This steady monetary policy stance signaled continuity in interest rate levels, bolstering investor confidence and influencing currency markets positively. Meanwhile, the Bank of Japan kept its policy rate unchanged at <0.10% since March’s increase from -0.10%, demonstrating ongoing commitment to accommodative monetary policy. This stability likely supported economic activities and investor sentiment in Japan, potentially aiding the Japanese Yen amidst global economic uncertainties.
Trade Balance  US Trade Balance:
April 4: -$68.9B (forecast -$66.9B)
May 2: -$69.4B (forecast -$69.5B)
June 6: -$74.6B (forecast -$76.2B)
Japan Trade balance:
April: -0.70T (forecast: -0.30T)
May: -0.56T (forecast: -0.72T)
June: -0.62T (forecast: -0.64T)
Impact
Throughout the second quarter, both the US and Japanese trade balances demonstrated widening deficits compared to forecasts. In April, the US reported a deficit of -$68.9B against an expected -$66.9B, followed by -$69.4B in May versus an anticipated -$69.5B, and -$74.6B in June compared to a forecast of -$76.2B. This consistent shortfall in the US trade balance potentially strained the US dollar, reflecting heightened imports relative to exports. Similarly, Japan experienced a widening trade deficit, surpassing expectations in April and June while showing marginal improvement in May. These developments could have exerted downward pressure on the Japanese Yen, given that increasing deficits often signal greater import dependency and may affect the currency’s stability in global markets.
US Dollar Index ( DXY ) Quarterly Review: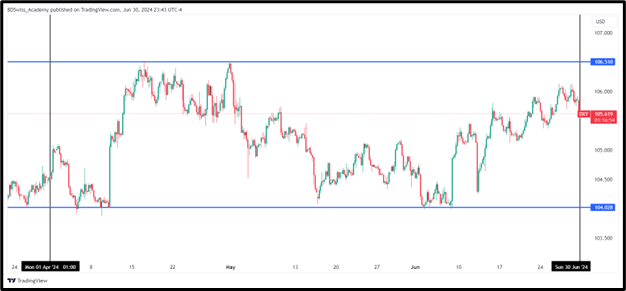
In the second quarter, the US Dollar Index (DXY) began at 104.498 and initially rose to 105.110 in early April before retracing to find support at 104.028, slightly lower than its starting point. It later surged to a peak of 106.510, the highest level of the quarter, before retracing once more to the established support at 104.028. Towards the end of the quarter, the index began to recover, currently hovering around 105.624.
Impact on the US Dollar:
In the early part of April, the US Dollar Index surged to 105.110, demonstrating initial strength likely buoyed by positive economic indicators or favorable market sentiment. Subsequent retracements to 104.028 indicated periods of dollar weakness, where this level played a pivotal role as a support zone throughout the quarter. A peak at 106.510 marked a significant high, possibly influenced by expectations surrounding interest rates or geopolitical tensions, impacting the dollar’s robustness. As of now, the index’s recovery to 105.624 suggests ongoing market adjustments, reflecting anticipation of economic developments and contributing to the dollar’s overall stability amid varied economic data releases, Federal Reserve policies, and global market sentiments observed throughout the second quarter.
Japanese Yen Index (JXY) Quarterly Review: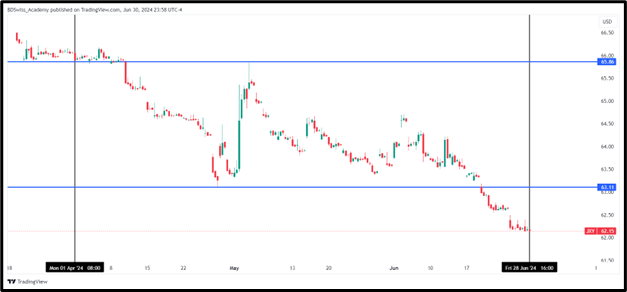
April:
Starting Point: JXY began at 65.86, with this level acting as initial support.
Movement: Broke below support to 63.11, then retraced to 63.86 (now resistance) but faced rejection.
May:
Continued Movement: After rejection, JXY resumed its decline towards 63.11 support.
Breakdown: Support at 63.11 broke around June 20th.
June:
Current Status: JXY is currently around 62.15, indicating a downward trend.
Impact on Japanese Yen:
The weakening trend of the JXY reflects bearish sentiment towards the Japanese yen. As the index broke key support levels and faced resistance at previous support turned resistance levels, it suggests increasing selling pressure on the yen. This could potentially lead to further depreciation of the yen against other major currencies, influenced by market sentiment and economic indicators impacting Japan’s economy.
USDJPY Q3 PROJECTION : TECHNICAL ANALYSIS 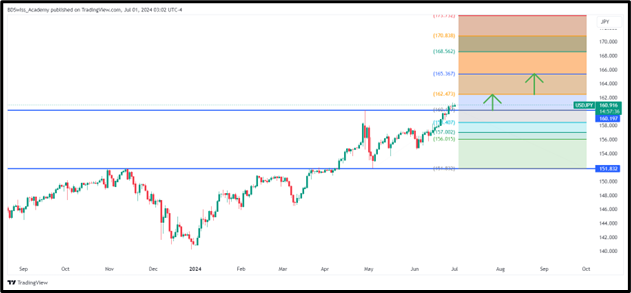
– USD/JPY identified resistance breakout on the daily chart at 160.157.
– If breakout sustains, potential move to 162.473 expected; further breach of 162.473 may lead to target at 165.367.
– Alternatively, failure of breakout could see the exchange rate decline to 158.407; further breach of 158.407 may extend downward movement to 157.002.
Apply Risk Management
Source:
https://www.forexfactory.com/calendar?day=jun18.2024
https://www.tradingview.com/u/BDSwiss_Academy/
https://images.app.goo.gl/3PaiAV9duYqo4hgV8


