


This article delves into the dynamic Q2 (April – June) performance review of the S&P 500, showcasing a turbulent journey. April marked a significant 4.2% decline, breaking a streak of previous gains, whereas May surprised with its strongest performance since 2009, driven by major tech companies. June concluded with the S&P 500 achieving its highest close in 14 months, buoyed by optimism surrounding inflation easing and potential peak interest rates. Explore the detailed insights into these market fluctuations and sectoral developments here!
April Review
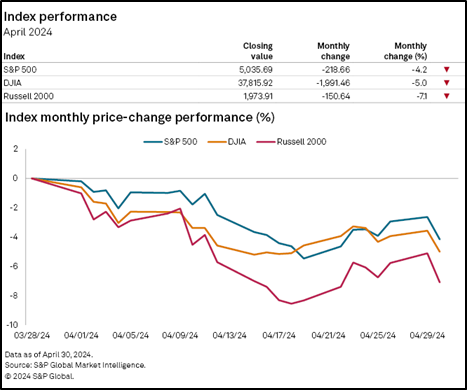
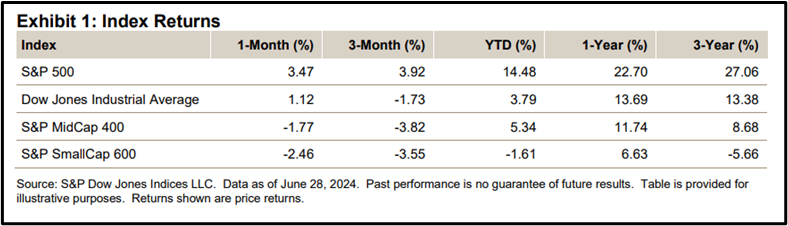
Market Performance: The S&P 500 slid 4.2% in April, ending a five-month streak of gains as market momentum weakened.
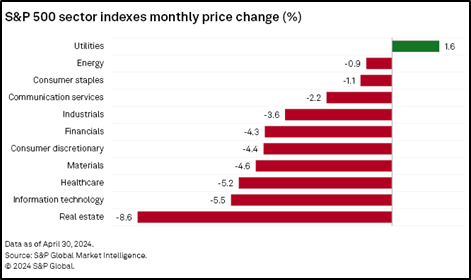
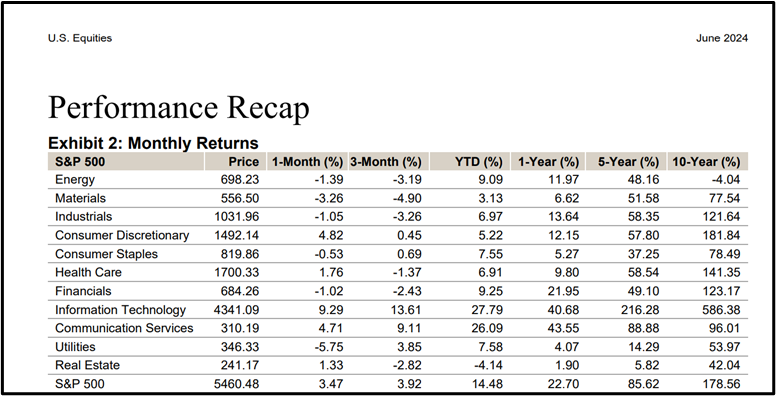
Sector Movements: Nearly all S&P 500 sectors declined, with utilities as the sole exception. NRG Energy Inc. led the utilities sector, rising 7.4%, while the real estate sector performed the worst, falling 8.6%. Prologis Inc. dropped 21.6%, the most within real estate.
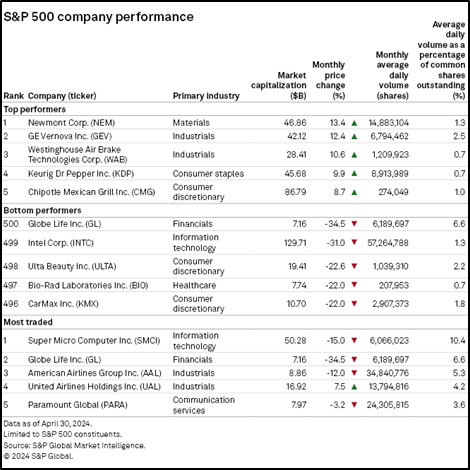
Top Gainers: Newmont Corp. topped the S&P 500 with a 13.4% gain, buoyed by rising gold prices and optimistic analyst predictions.
Top Losers: Globe Life Inc. saw the steepest decline, plummeting 34.5% following fraud allegations by a short seller. The company’s denial of these claims and the impact on a potential deal were highlighted in their earnings call.
May Review
The S&P 500 defied the “sell in May and go away” adage, delivering its strongest May performance since 2009. This rally, however, was primarily driven by a select few heavyweights, as top stocks ( Microsoft, Apple, Nvidia, Alphabet, Amazon and Meta ) surged ahead while the broader market gained at a slower pace.
– The S&P 500 surged nearly 4% in May, achieving its best May performance since 2009 and its second-best May in the past 20 years, according to FactSet data.
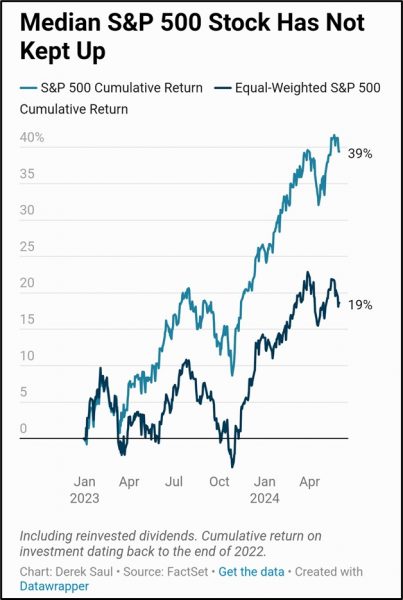
– However, it was an uneven month for individual investors: the market cap-weighted S&P 500, favoring larger companies, outperformed the equal-weighted S&P 500, which treats all 500 stocks equally, for the fifth consecutive month in 2024.
– The equal-weighted S&P 500 rose just 1% in May, highlighting the gap with the market cap-weighted index, which is up 10% year-to-date (including dividends) and 39% since the start of last year, compared to the equal-weighted index’s 4% and 19% gains, respectively.
– The rally was primarily driven by the largest stocks—Microsoft, Apple, Nvidia, Alphabet, Amazon, and Meta—adding $1.3 trillion in market cap, accounting for 76% of the index’s total gains.
– These tech giants, part of the former “magnificent seven,” now represent 30% of the S&P 500, up from 28% at the beginning of the year, pushing the index toward its most top-heavy level since the Great Recession, as tracked by Bank of America.
June Review
 – In June, NVIDIA buoyed the S&P 500, which posted a 3.47% gain despite negative market breadth with 201 advancers and 301 decliners.
– The quarter saw a 3.92% rise, balancing May’s 4.80% increase against April’s 4.16% dip, leading to a 14.48% year-to-date return, bolstered by Q1’s 10.18% gain.
– The “Magnificent 7” stocks dominated, contributing 79% to the overall return, without which June’s gain would have been just 0.76%.
– Trading activity increased by 1% in June, with no days exceeding 2% movement and only 1 out of 19 days showing at least 1% movement.
– Despite the index’s overall gain, breadth was negative with fewer advancers (201) compared to May (327), and significant gainers (10% or more) dropped to 29 from May’s 62. Conversely, 301 stocks declined, with 21 falling at least 10%.
 Throughout, NVIDIA played a pivotal role in market sentiment and trading dynamics across the index where Nvidia (NVDA) executed 10-for-1 stock split.
Apple’s Worldwide Developers Conference pushed shares to record highs, while Tesla’s shareholders approved a significant compensation package for Elon Musk. Hewlett Packard Enterprise surged on strong AI server sales, and several companies executed stock splits to attract more investors.
Technical Analysis Review 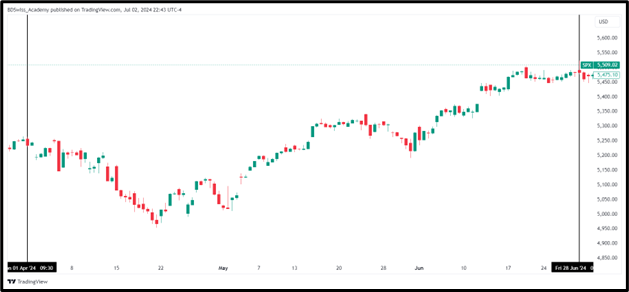 Throughout Q2, the S&P 500 experienced a bullish trend. The quarter commenced on April 1st, 2024, opening at 5257.31 points, dipping to a monthly low of 4952.64 points by April 19th, 2024, before rebounding to surpass the opening level and breach resistance on April 15th, 2024. Following the breakout, the new support level was tested on May 31st, 2024, confirming the bullish momentum that carried through the quarter, culminating in a June close at 5492.01 points.
Q3 Technical Analysis Forecast
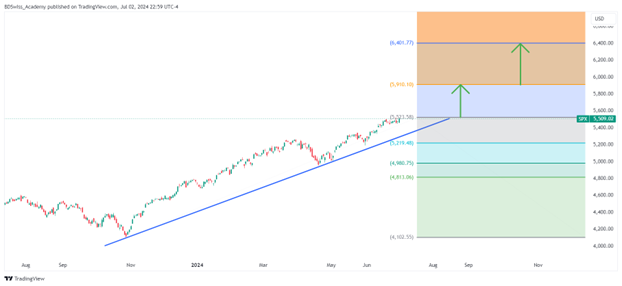 Technical Analysis Alert: A potential resistance breakout was identified on the daily chart of the S&P 500 at 5523.58 points.
Upside Targets: If the breakout holds, there is a strong likelihood of the index climbing to 5910.10 points. Further upside momentum could push it towards 6401.77 points upon breaking the 5910.10 level.
Downside Scenarios: Conversely, if the breakout fails, there is a significant probability of the index declining to 5219.48 points. Breaking below 5219.48 could lead to further downside towards 4980.75 points.
Source:
https://www.spglobal.com/spdji/en/media-center/news-announcements/#corporateNews
https://www.spglobal.com/spdji/en/commentary/article/us-equities-market-attributes/


