

Previous Trading Day’s Events (19 Feb 2024)
______________________________________________________________________
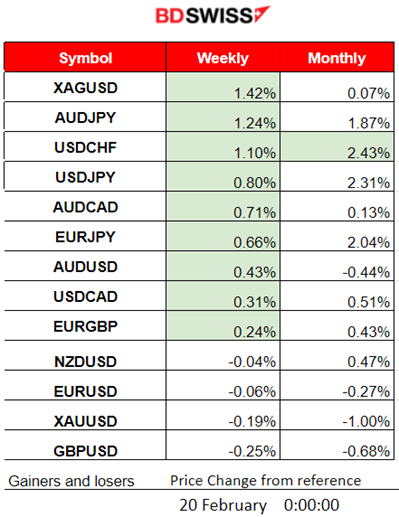
Winners vs Losers
Silver (XAGUSD) remains in the lead with 2.46% gains last week. The USDCHF is on the top for the month with 2.14% gains so far.
 ______________________________________________________________________
News Reports Monitor – Previous Trading Day (19 Feb 2024)
Server Time / Timezone EEST (UTC+02:00)
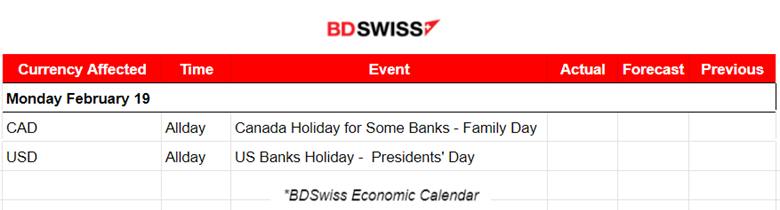
- Midnight – Night Session (Asian)
No important announcements, no special scheduled releases.
- Morning – Day Session (European and N. American Session)
No important announcements, no special scheduled releases.
General Verdict:
 ____________________________________________________________________
FOREX MARKETS MONITOR
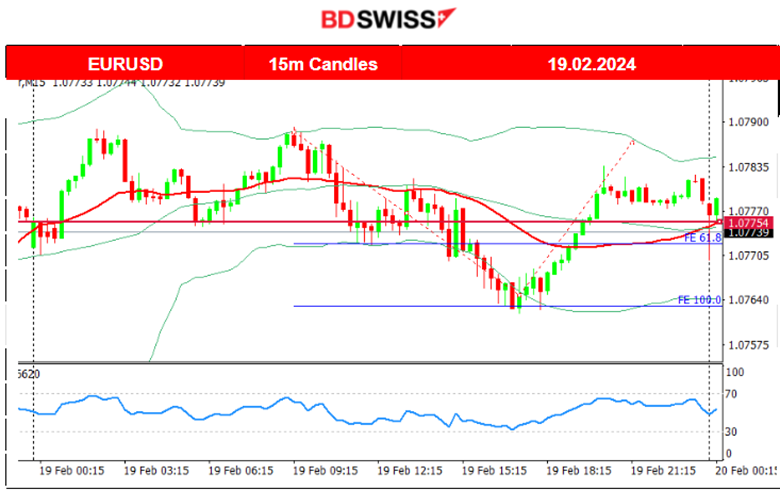
EURUSD (19.02.2024) 15m Chart Summary
Server Time / Timezone EEST (UTC+02:00)
Price Movement
The absence of important scheduled releases and U.S. holiday had kept the volatility low. The pair moved mainly sideways before the start of the European session. After that, the pair moved to the downside deviating moderately from the 30-period MA but after finding support near 1.07640 it retraced to the MA, crossing it on its way up and returning to the mean.
 ___________________________________________________________________
CRYPTO MARKETS MONITOR
BTCUSD (Bitcoin) Chart Summary
Server Time / Timezone EEST (UTC+02:00)
Price Movement
Early on the 14th Feb, Bitcoin climbed again aggressively reaching up to 52,600 USD on the 14th and even reached 52.800 USD on the 15th Feb before retracing. On the 17th Feb Bitcoin fell rapidly reaching support near 50,550 USD before reversing fully back to the 30-period MA. Since the 17th Feb, it has been on an upward path that forms an upward wedge. The level 52,600 USD seems to be a significant resistance level. On the 19th Feb, Bitcoin broke the wedge and moved rapidly to the downside, under the 30-period MA, confirming the bearish signals from the RSI (lower highs).
 Crypto sorted by Highest Market Cap:
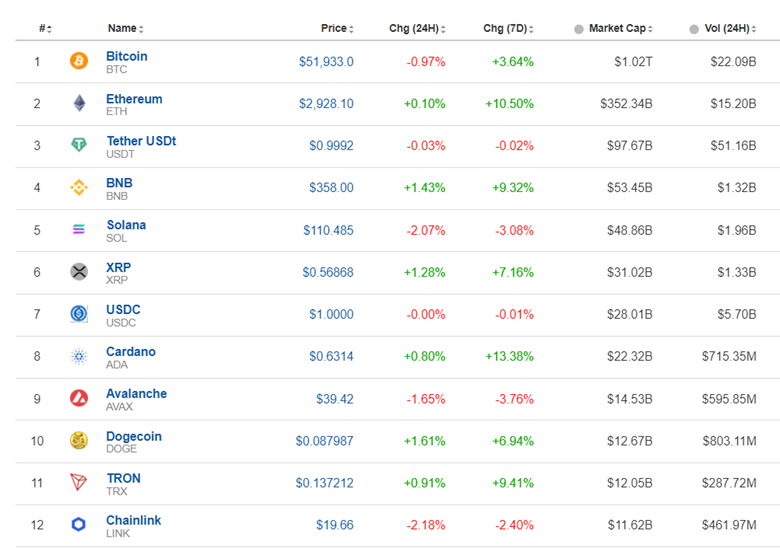
Volatility is back in the Crypto markets. Mixed performance for the last 7 days as there is no clear major direction to any side. Bitcoin remains high and close to important resistance.
Source: https://www.investing.com/crypto/currencies
______________________________________________________________________
EQUITY MARKETS MONITOR
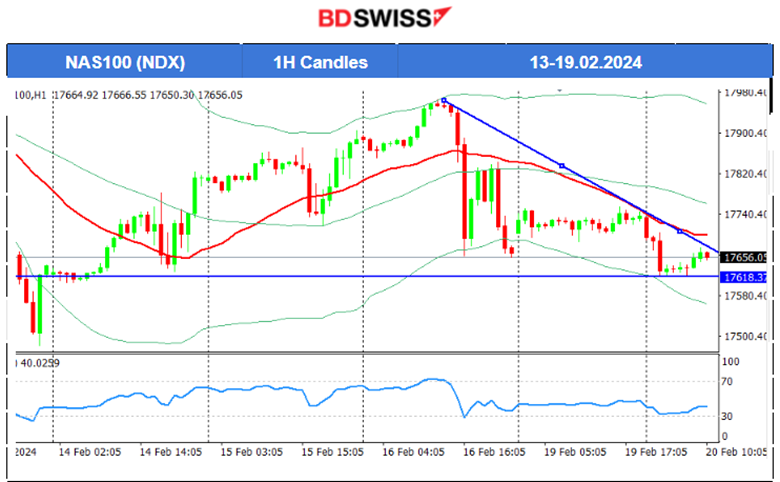
NAS100 (NDX) 4-Day Chart Summary
Server Time / Timezone EEST (UTC+02:00)
Price Movement
On the 14th Feb and 15th Feb, the index climbed further. All three U.S. benchmark indices experienced the same path. On the 16th the index found resistance at 17,970 USD and immediately dropped with the PPI data release for the U.S. The index found support at that time near 17,660 USD before retracing to the 61.8 Fibo level and later back to the 30-period MA. Another drop followed causing the index to close lower and remain close to 17,700 USD. On the 19th Feb the market remained sideways experiencing very low volatility due to the closed stock exchange. However, today the market opened with a downward path breaking important support levels. Next support could be the 17,500 USD.
 ______________________________________________________________________
COMMODITIES MARKETS MONITOR
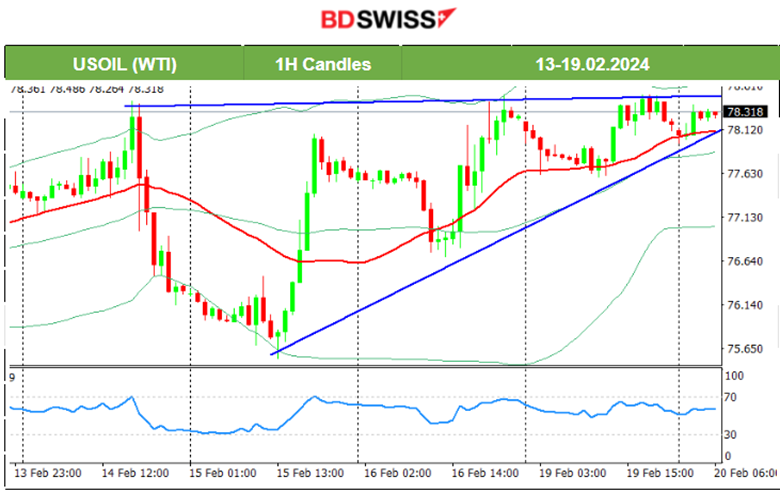
USOIL (WTI) 4-Day Chart Summary
Server Time / Timezone EEST (UTC+02:00)
Price Movement
On the 14th Feb, the release of the Crude oil inventories report at 17:30 caused a price drop that extended until the end of the trading day, about 18 USD drop. The reported figure was indeed a high number, 12M barrels, a huge Crude build. U.S. production is back at record highs. On the 15th Feb correction took place, with the price to reverse almost fully. On the way up, Crude oil crossed the 30-period MA and reached a resistance near 78 USD/b. It soon retraced to the mean on the 16th Feb but bounced back to the upside eventually reaching the resistance at 78.50 USD/b. It is apparent that Crude oil is showing a triangle formation. The Resistance at 78.50 USD/b is important. The triangle breakout to the downside creates opportunities for a short position. 77 USD/b could be a possible next support in that scenario. The uptrend is strong however and bets are more about the resistance breakout instead.
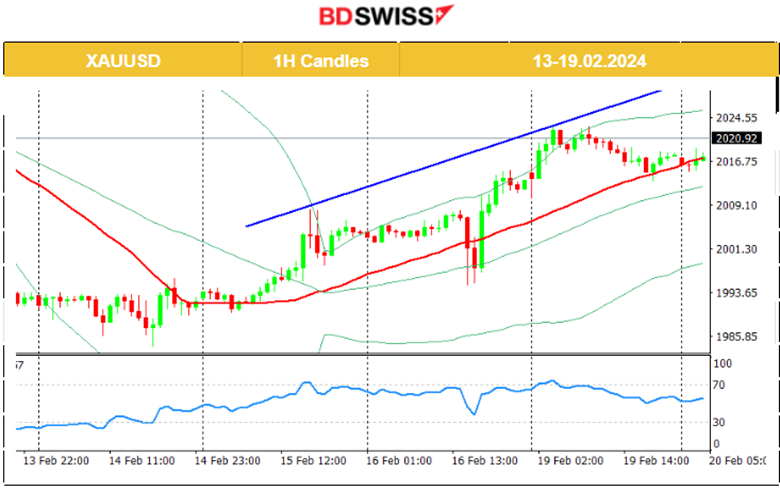
 XAUUSD (Gold) 4-Day Chart Summary
Server Time / Timezone EEST (UTC+02:00)
Price Movement
Since the 15th Feb, Gold’s price is correcting from the drop caused by the recent U.S. inflation report. On the 16th Feb the price dropped after the PPI news and USD appreciation, reaching support at near 1995 USD/oz before reversing to the upside. The USD currently experiences weakness and is one major factor that pushes Gold’s price more to the upside. Gold is currently trading just little more than 2020 USD/oz with bearish RSI signals in place.
 ______________________________________________________________
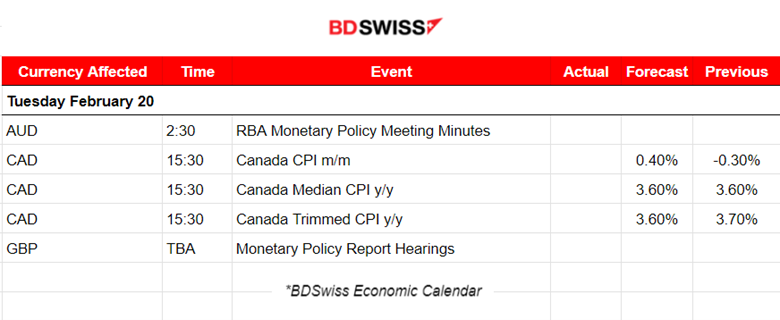
News Reports Monitor – Today Trading Day (20 Feb 2024)
Server Time / Timezone EEST (UTC+02:00)
- Midnight – Night Session (Asian)
At 2:30 some volatility was recorded for AUD pairs as the RBA Monetary Policy Meeting Minutes release took place. RBA Minutes: The board considered an interest-rate hike, and saw the pause case as stronger though. They needed ‘Some Time’ to be certain of an inflation decline.
- Morning – Day Session (European and N. American Session)
The CPI data for Canada will be reported at 15:30. On a monthly basis, analysts expect growth instead of a decline. Annual inflation is recorded below 3% and seems to have lowered significantly in the 4th quarter of 2023. For January it was reported 2.6%. A less-than-expected figure will probably cause more volatility for CAD but a decline instead will possibly cause the CAD to depreciate heavily.
General Verdict:
______________________________________________________________


