

Previous Trading Day’s Events (08.07.2024)
______________________________________________________________________
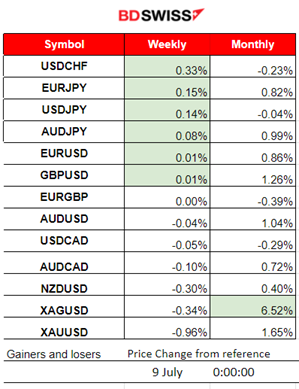
Winners vs Losers
USDCHF climbed to the top as the USD stabilised from weakening and the CHF started to lose ground. JPY pairs (JPY as Quote) reached the top again as the JPY experienced some weakening against other currencies. Silver still thrives this month with 6.5% gains.
 ______________________________________________________________________
News Reports Monitor – Previous Trading Day (08.07.2024)
Server Time / Timezone EEST (UTC+03:00)
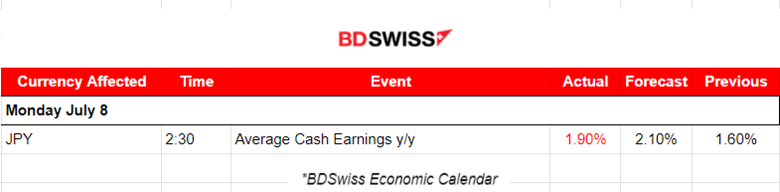
- Midnight – Night Session (Asian)
No important news announcements, no important scheduled releases.
- Morning – Day Session (European and N. American Session)
No important news announcements, no important scheduled releases.
General Verdict:
 __________________________________________________________________
FOREX MARKETS MONITOR
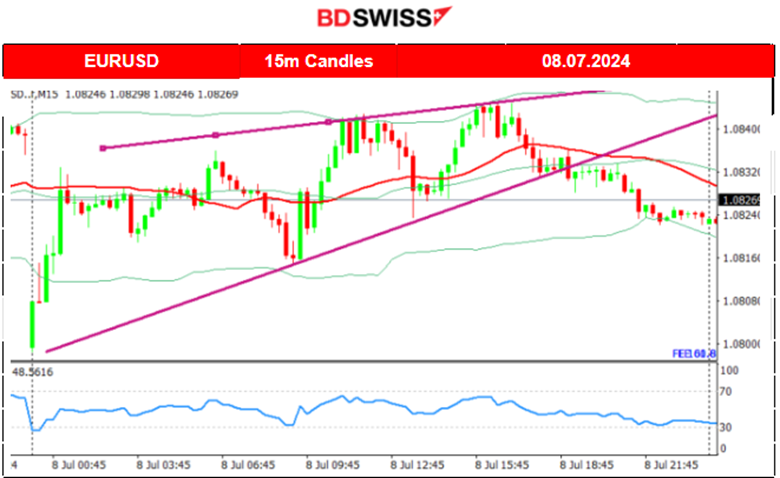
EURUSD (08.07.2024) 15m Chart Summary
Server Time / Timezone EEST (UTC+03:00)
Price Movement
The pair moved roughly sideways but with high volatility. There was no doubt that activity in the market was at a high level, however, uncertainty about the future value of currencies eventually led to a sideways 30-period MA and high deviations from it. What seems to appear as a triangle formation was broken to the downside, however the lower band of the 50-period Bollinger Bands acted as a strong intraday support.
 ___________________________________________________________________
CRYPTO MARKETS MONITOR
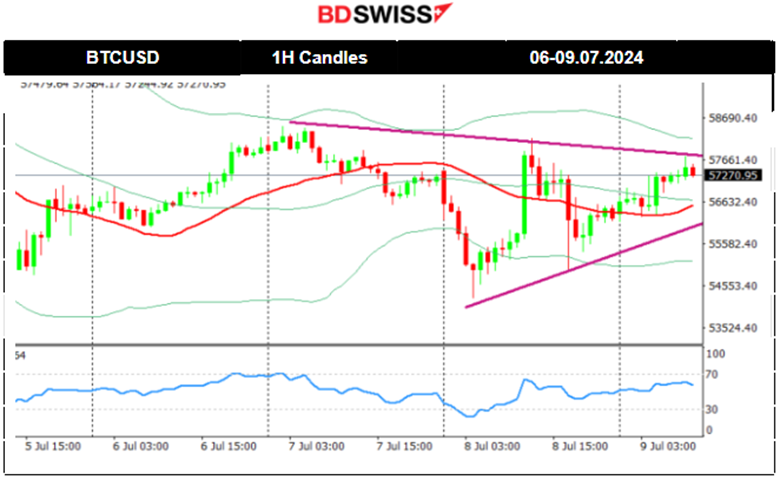
BTCUSD (Bitcoin) Chart Summary 1H
Server Time / Timezone EEST (UTC+03:00)
Price Movement
On the 5th of July, the price fell further breaking the 57K USD level and dropped to the next support at 54K USD. Since then the market recovered and corrected by moving upwards and crossing the 30-period MA. The price remained close to the MA as it continued moving sideways with a clear mean level at nearly 57K USD for now. The latest price data formed a triangle indicating that volatility levels lowered and that could be the predecessor of a future rapid movement upon triangle breakout.
 Crypto sorted by Highest Market Cap:
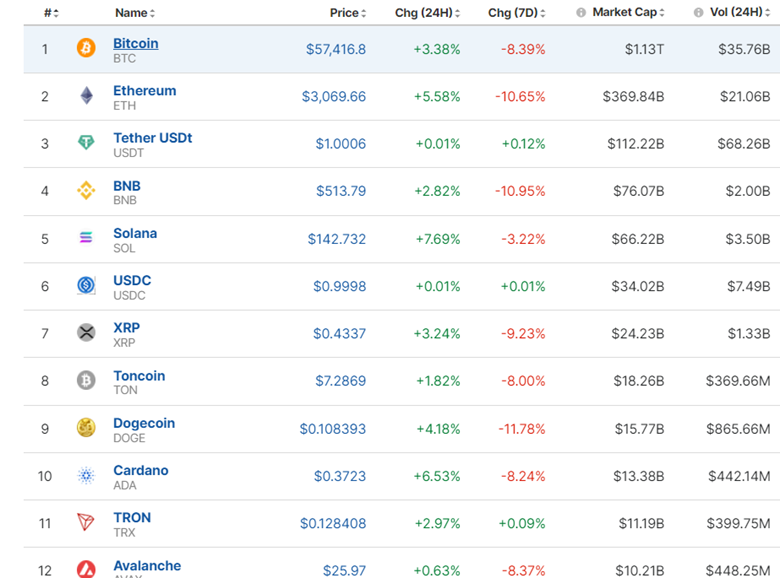
Most Crypto suffered losses lately. The last few days however we see some correction, eliminating some of the losses. In the last 24 hours prices made some progress but they are only moving sideways with high volatility. No significant correction has taken place so far.
https://www.investing.com/crypto/currencies
______________________________________________________________________
EQUITY MARKETS MONITOR
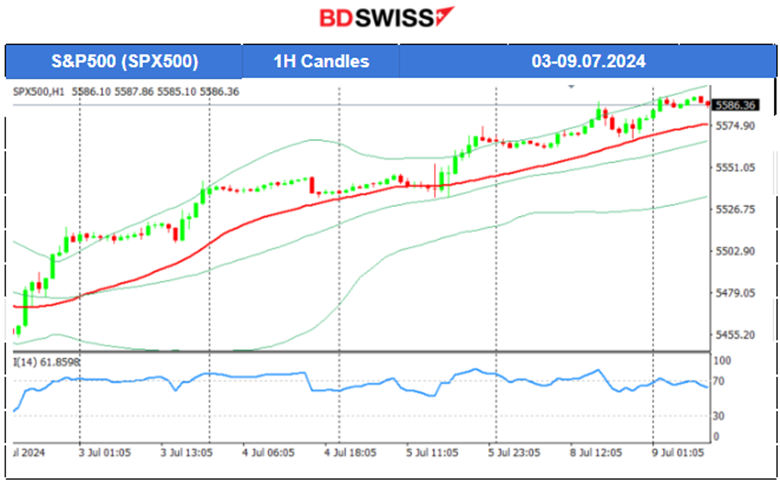
S&P500 (SPX500) 4-Day Chart Summary
Server Time / Timezone EEST (UTC+03:00)
Price Movement
After some price action that looked like a slowdown due to the holiday, on the 5th of July, the index moved aggressively upwards again early during the Asian session on the index (futures) market opening. Retracement took place. This week started with a more aggressive upward movement for the index. Looking at things from afar, no significant correction is expected yet. A clear uptrend.
 ______________________________________________________________________
COMMODITIES MARKETS MONITOR
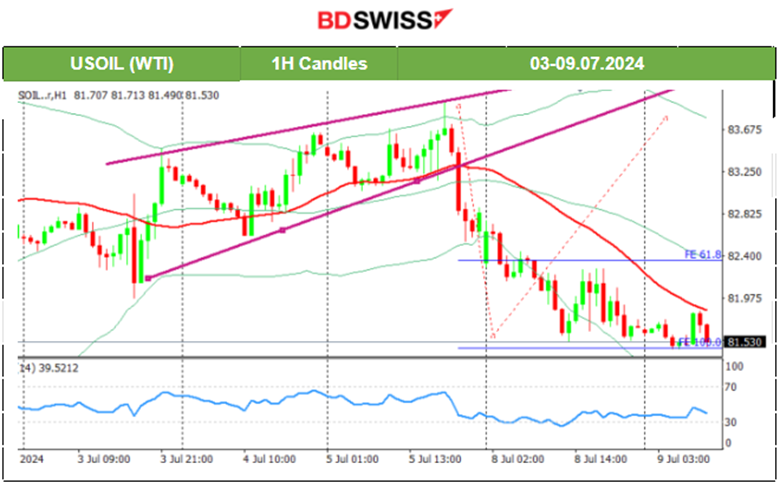
USOIL (WTI) 4-Day Chart Summary
Server Time / Timezone EEST (UTC+03:00)
Price Movement
On the 4th, the price remained above the 30-period MA and continued upwards within the channel. However, a triangle formation was formed and on the 5th of July after 18:00 server time, the price dropped heavily breaking that triangle to the downside. The fall extended to the support near 81.5 USD/b and then retraced to the 61.8 Fibo level before it started to test that support again now. There is potential for that breakout and a further downward movement of Crude oil’s price.
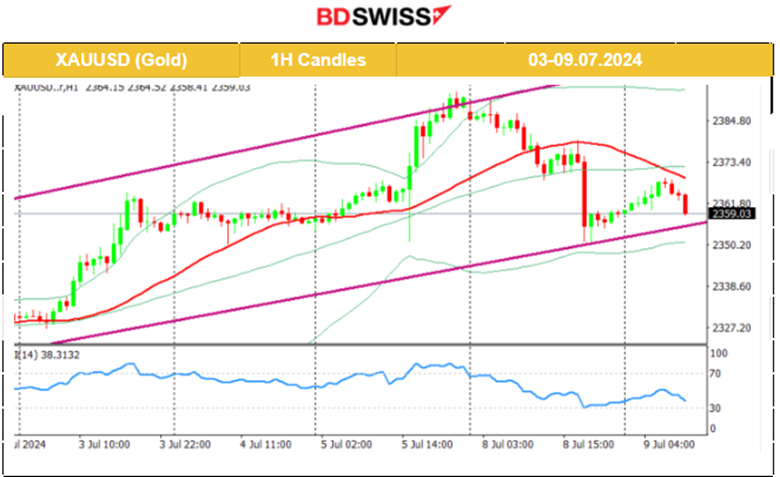
 XAUUSD (Gold) 4-Day Chart Summary
Server Time / Timezone EEST (UTC+03:00)
Price Movement
Gold jumped due to the USD’s early depreciation and tested the high at 2,365 USD/oz on the 5th of July. On the same day, it jumped again during the NFP release. It was an intraday shock that resulted in increased demand for metals, pushing Gold upwards in order to technically complete the breakout of the previous triangle formation and reaching the next target level at nearly 2,393 USD/oz as mentioned in our webinar on Friday. On the 8th it corrected from that jump and moved significantly to the downside. It crossed the 30-period MA and found support at 2,350 USD/oz before it retraced to the MA. It could be the case that the support will be tested again as the price remains below the MA and signals the potential beginning of a downtrend.
 ______________________________________________________________
News Reports Monitor – Today Trading Day (09.07.2024)
Server Time / Timezone EEST (UTC+03:00)
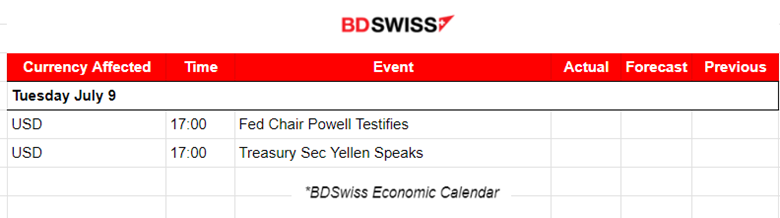
- Midnight – Night Session (Asian)
No important news announcements, no important scheduled releases.
- Morning – Day Session (European and N. American Session)
No important news announcements, no important scheduled releases.
General Verdict:
______________________________________________________________


