Rates as of 04:00 GMT
Market Recap
Oil gained after Trump released the following tweets:

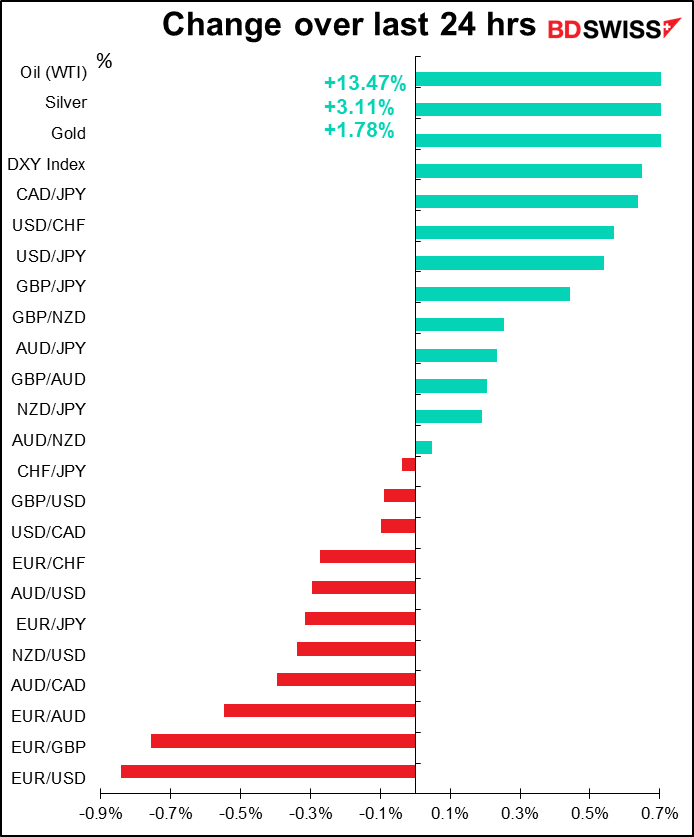
The price spiked temporarily – Brent immediately went shooting up $9.62 or 36% while WTI jumped $5.29 or 24% — but lost most of the gains just as quickly. Still, WTI is currently up 13.5% and Brent up 10.4% from where they were yesterday morning at this time.
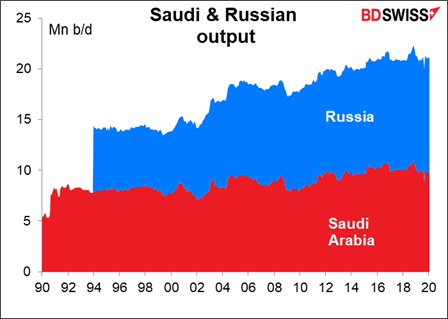
The reason the price came back down is that these figures are so unbelievable as to make one wonder whether the person saying them understood what he was talking about. Energy Intelligence Group (EIG) estimates that over the last three months, Saudi Arabia has averaged 9.71mn b/d and Russia has averaged 11.27mn, so 20.994mn b/d together. The idea that they would each cut their output in half is, well, ludicrous doesn’t express it well enough, because it only implies ridicule of the idea, whereas we’re looking for a word that will also imply contempt for the person who said it too. Of course perceptive readers may note that he says “cutting back approximately 10 million barrels…” He didn’t say “barrels per day..”
Note too that these conversations were not confirmed by either Russia or Saudi Arabia. On the contrary, Russia denied that Putin had spoken with MBS.
Saudi Arabia did produce somewhere in the 5mn b/d range in 1990, but since 1991 the lowest has been 6.9mn b/d (I only have data from 1990). Russia was producing over 6mn in 1994 (the earliest I have data for) but in the late 1990s was producing in the 5mn b/d range. In any event, the idea that they would suddenly cut back production to levels last seen 20 or 30 years ago is, well, difficult to imagine.
Furthermore, as I explained yesterday, the International Energy Agency estimates the global oil overhang at around 20mn b/d, so even if this ridiculous statement were true, it would not mean the end of the global oil glut, just a slowdown.
Nonetheless, people assumed that there must be something in the works here – some cutback by these two countries – and that caused a marked improvement in sentiment, both in the oil market and stocks.
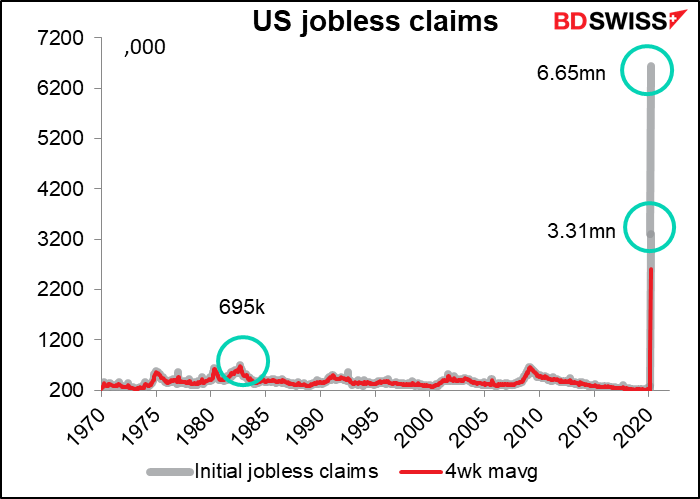
It’s really incredible, because it comes at the same time as the unbelievable jump in initial jobless claims. Maybe you thought things couldn’t get worse after the previous week’s 3.3mn jobless claims, but they did – an additional 6.65mn claims, worse than even the worst that people imagined (the highest estimate on Bloomberg was 6.0mn). To make matters worse, the indications are that the systems being used to register claims are still overwhelmed and haven’t been able to keep pace with the filings, so there’s worse yet to come.
The question I have is, is the US unique in this response? I think US labor laws are probably about as strong as those of the average third-world dictatorship, meaning the US is probably hardest hit among the G10 countries. Conditions are probably much better in Europe and Japan, where the emphasis is on keeping employees in place so that companies can start up again when this is all over. But still, everyone is going to be hard hit. We should imagine something like this globally.The UK Office of National Statistics said that 27% of companies reduced staff levels between 9 and 22 March, and that was before the lockdown on 23 March.
One analyst did make an interesting point: Europe goes through something similar every year, when much of the continent shuts down for vacation in August. It doesn’t kill the economy at all. But of course those people then go somewhere and spend money that becomes the income of people in that region, whereas now no one is spending any money. Example: the entire US domestic box office (movie theaters) revenue for the week March 20-26 was $5,179, vs $204,193,406 for the same week a year ago.
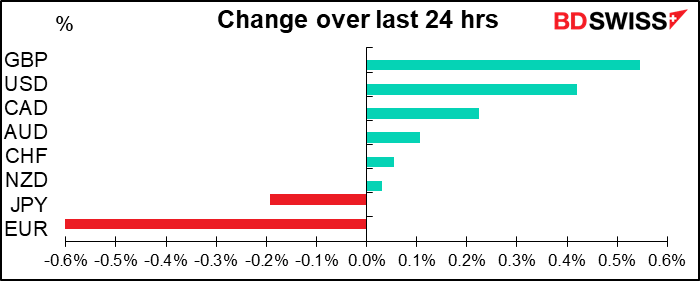
In the FX market, EUR fell on strong dollar demand and unwinding of some long EUR positions. The market seems worried about the impact of the virus on the European economy as many countries are in total lockdown. There were reports that Germany is expecting GDP to fall by up to 10%. However, I think this is going to be a rolling concern – that is, the countries to come to grips with the problem first will be those that exit from these extraordinary measures first, too. So sooner or later it should be the USD’s turn, assuming that is that central banks can manage the exceptional demand for dollars from borrowers rolling over their loans and hedges. While Europe may be going into recession earlier, I think the labor laws will keep their economies intact better than the US and therefore the recovery will be earlier and fuller as well.
I’m puzzled by the recent gains in GBP. As total global cases of COVID-19 surpass 1mn and fatalities exceed 50k, the US, UK, and Turkey are the only major countries in the top 10 of total cases that still have double-digit daily growth in new cases. New cases and death rates are slowing in Italy and Spain, a good sign that countries that took early steps to deal with the crisis are also likely to see an early end. That should be negative for USD and GBP, I would think. USD has the underlying issue of rollovers of dollar loans and hedges, but I don’t know what’s supporting GBP. Perhaps it’s just mean reversion of a bombed-out currency after the end of Q1.
Today’s market
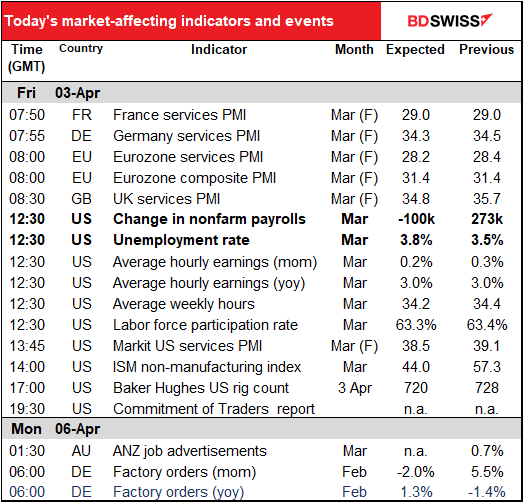
The day starts with the revised version of the service-sector purchasing managers’ indices (PMIs) for March for the major industrial countries as well as the numbers for all the smaller countries. Downward revisions are likely.
Then we start the countdown for a data release that’s gotten a new lease on life: the monthly US nonfarm payrolls. It was losing its significance there for a while as unemployment got down to levels where it was no longer significant for monetary policy. Well, it’s probably no longer significant for monetary policy directly, since policy is already flat out, but it’s a good indicator for the health of the US economy and will be closely watched for that.
The median estimate of the 72 economists polled by Bloomberg is -100k. Meanwhile, the Bloomberg “whisper” figure, compiled from anyone with a Bloomberg subscription who wants to take a guess is a much larger -222k. This is an indication of what the average market participant thinks is likely.
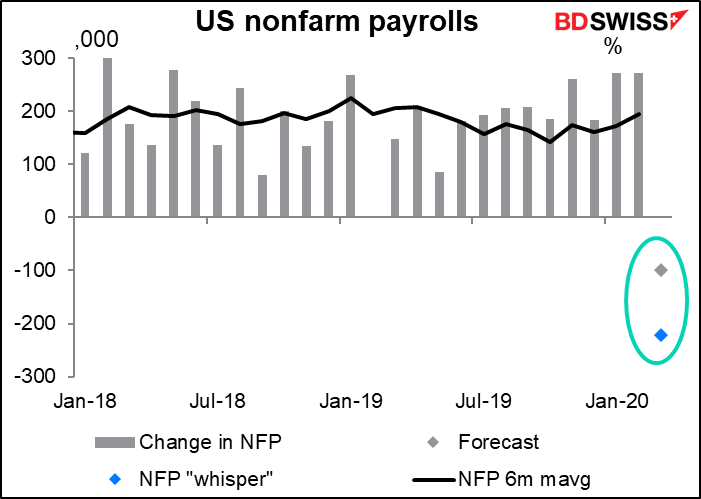
The dispersion of forecasts this month is incredible. While the median forecast is -100k, the average estimate is -250k. There’s never such a big difference between the median and the average estimate for this indicator. Last month for example the median estimate was 175k and the average estimate was 175.4k, the month before it was 165k and 165.5k, etc.
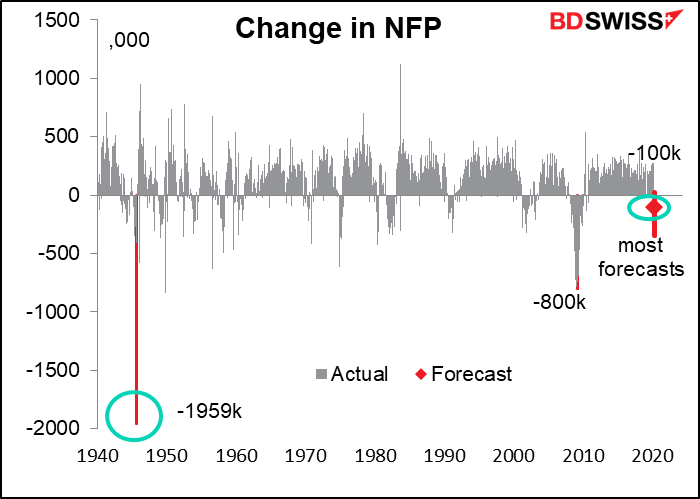
Economists’ guesses estimates this month range from -4mn (Robert Brusca at Fact & Opinion Economics) to +100k (Ian Shepherdson at Pantheon Macroeconomics). I have to say though that Mr. Brusca has really gone out on a limb: there’s one other person at -3.5mn, one at -2.0mn, and two at -1.0mn. So there are relatively few people expecting a multi-million drop in NFP (although these forecasts were made before yesterday’s shocking initial jobless claims figure). Most people are clustered between -350k and +30k.
The following graph puts those forecasts in perspective of the history of this data series. The worst recent fall was -800k in March 2009, but of course that came during a period of month-after-month declines – there were declines every month from Feb. 2008 to Oct. 2009, totaling 8.4mn people all told (and further declines sporadically after that).
You may be surprised that anyone is forecasting a rise in payrolls despite the incredible 3.3mn initial jobless claims for 21 March. They’re not crazy though. On the contrary, Mr. Shepherdson is quite well respected in the financial industry. The reason, as I explained yesterday, is that in order to be counted as “unemployed,” workers have to be unemployed for the entire pay period containing the 12th of the month. As a result, if you’re paid monthly and you work even one day during the month – say, March 1st – and are then laid off, you don’t count as unemployed until April. Even people who are paid weekly and were laid off on the 16th will still be counted as employed. And for the week containing the 12th (9th-13th of March), initial jobless claims were higher than usual at 281k vs 211k the week before, but still not in the millions by any means. The deluge came later in the month, as we saw yesterday.
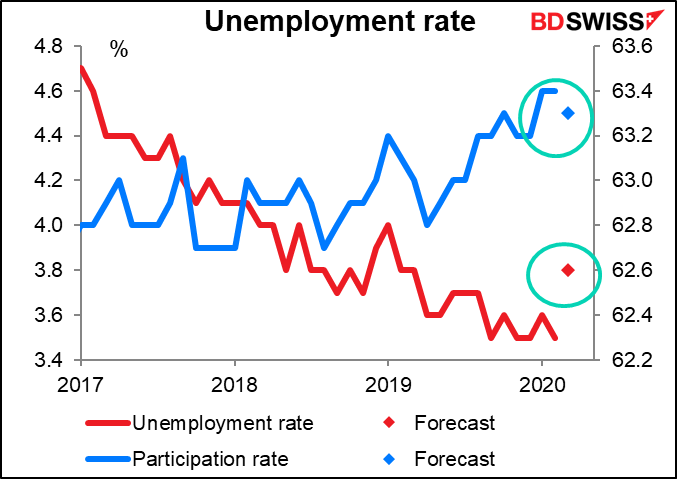
There’s the same and even worse problems with the unemployment rate. That too is derived from a survey taken on the week containing the 12th of the month. Anyone laid off on the 16th would therefore be counted as employed. Furthermore, to be considered unemployed you have to be actively looking for work, and I wonder how many people are bothering to look when they’re on lockdown anyway. We should pay particular attention to the participation rate – the number of people employed or looking for work as a percentage of the total working-age population — as it’s likely to decline as well. The forecast is for only a modest fall, but more is likely to come, in my view, as people who are thrown out of work give up even trying until things get back to a more normal situation.
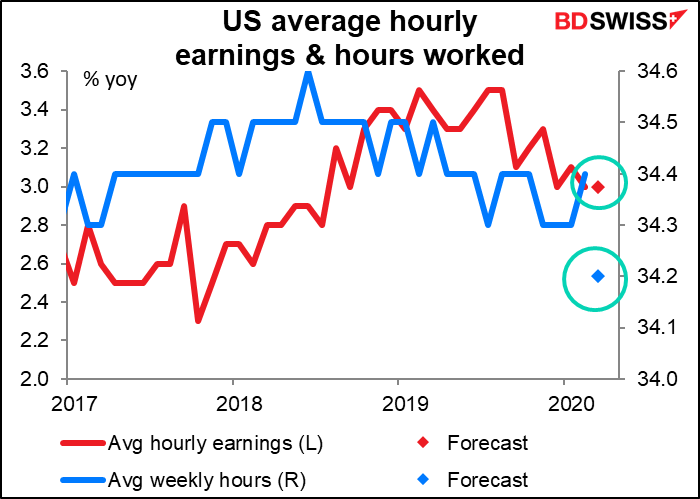
Recently, the average hourly earnings figure has been arguably more important than the nonfarm payroll figure itself. That’s because higher earnings are often a harbinger of higher prices as companies try to maintain their profit margins. It’s therefore an important early indicator of potential inflationary pressures. However, I think at this point inflationary pressures are the last thing on anyone’s mind, so earnings are not going to be as important as it was recently.
On the other hand, the hours worked figure, which no one has paid any attention to for the last several months, is much more significant now that companies are likely to be shortening their workweek (if indeed they’re still open at all). One-tenth of an hour on the average workweek is roughly equivalent to around 250k jobs in terms of aggregate income creation. What that means is that if the average workweek does drop by 0.2 hours this week, as the market expects, that’s equivalent to 500k people losing their job as far as spending power is concerned. Since the economy is basically powered by individual consumption, this loss of income is quite significant – quite on the same magnitude as the usual monthly change in the NFP.
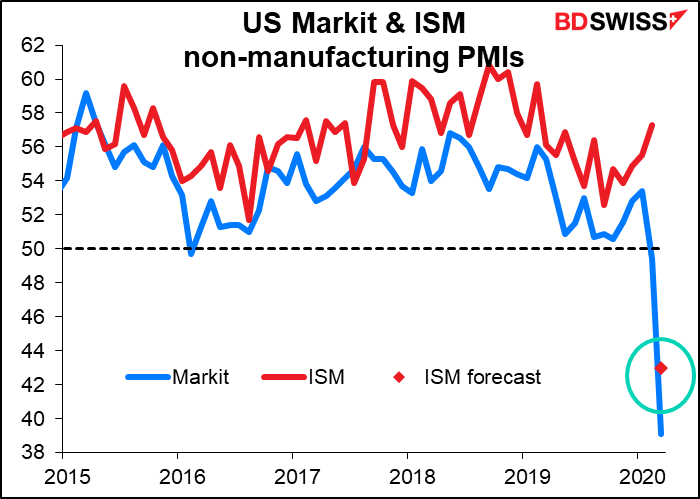
The Institute of Supply Management (ISM) non-manufacturing purchasing managers’ index (PMI) is expected to plummet, as you might well imagine. Not as much as the Markit non-manufacturing PMI did, but plummet nonetheless.
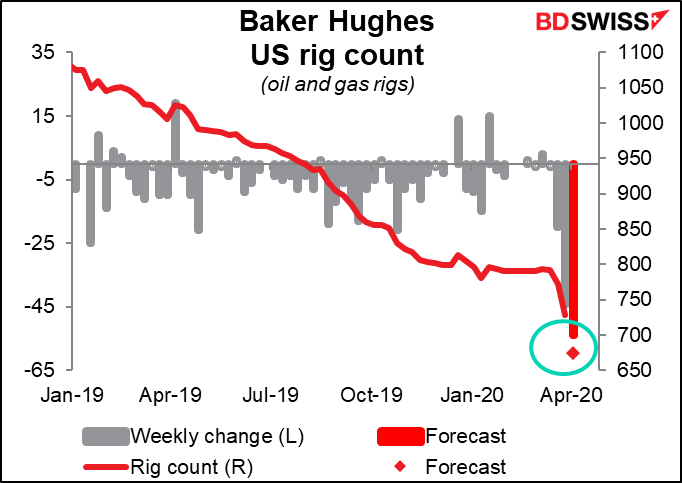
The weekly Baker Hughes rig count is back in fashion nowadays as the oil glut weighs on prices. This is a measure of how many oil and gas rigs are in operation every week. The fewer the rigs, the less oil and gas will be produced. In theory that should shore up prices, but in fact it just means more companies are likely to go bankrupt because of no money coming in.
The number has been steadily declining over the last year or more and recently began accelerating. The forecast decline of 54 rigs would be the largest since Q1 2015.