Rates as of 05:00 GMT
Market Recap
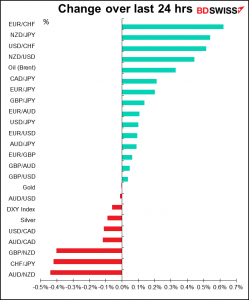
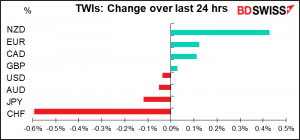
A day of small moves except as you can see for two currencies: NZD and CHF.
NZD rose after NZ PM Ardern said lockdown restrictions will be partially eased outside of Auckland, the country’s largest city and the epicenter of the recent outbreak. “We are seeing a decrease in cases outside of households, a decreasing number of locations of interest, and the reproduction rate reducing,” she said.
The seven-day moving average of new cases is still extraordinarily high for the country, but it is down from the previous day.

CHF on the other hand…who has any idea why CHF moves? It’s not really a function of the domestic economy, probably because the Swiss National Bank (SNB) has been on hold since 2015. We can therefore probably rule out position adjustment ahead of Thursday’s Swiss CPI and GDP.
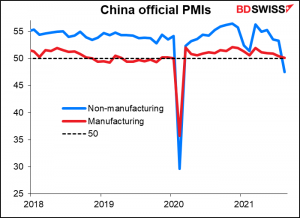
CHF usually moves based on global risk appetite, but there was no major change there either – US stocks moved further into record territory, while Asian stocks are mixed this morning. (China-related stocks are generally down, perhaps because the China service-sector purchasing managers’ index unexpectedly fell into contractionary territory at 47.5, down from 53.3 (52.0 expected)). Moreover JPY barely budged, which suggests that didn’t have a major effect on overall risk sentiment.
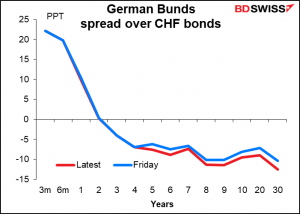
A rally in German bonds widened the spread been Bunds and CHF bonds slightly – 1.4 bps in the 10-years and 2.1 bps in the 30-years – but that small move hardly seems sufficient to account for the unusually large move in the currency.
Thus we are left with “supernatural forces operating in the market,” aka the SNB, to account for the move in CHF.
Today is the last day of the month, when portfolio rebalancing can move currencies. That is, investors in global stock markets who are supposed to keep a stable weighting of national markets in their portfolio have to buy stocks of markets that have fallen and sell stocks of markets that have risen in order to get their weightings back to where they should be. The result can affect currencies as well.
According to my former colleagues at Deutsche Bank, this could give rise to flows into CAD, GBP, and CHF (in that order) and small flows out of USD and JPY. Morgan Stanley largely agrees; they expect flows into CHF and GBP and out of USD.
Gerrman elections
I wrote a detailed article about the upcoming German elections (Germany’s Election: What it means for Germany and Europe) Since I wrote that however the odds have shifted notably. I’ll have to go back and edit it.
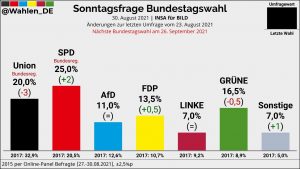
Specifically, the center-left Social Democratic Party (SPD), which earlier was trailing the ruling Christian Democratic Union/Christian Socialist Union (CDU/CSU), is now leading the pack. An Insa poll put the SPD at 25%, ahead of both the CDU/CSU at 20% and the Greens with 16.5%. The SPD’s 5-point lead over the CDU/CSU is the biggest SPD lead so far in this election cycle. Furthermore, that comes after a weekend TV debate between the three chancellor candidates, after which a Forsa poll showed that 36% of viewers thought the SPD’s Olaf Scholz was the winner and the CDU’s Armin Laschet last with 25% (the Green’s Annalena Baerbock got 30%). So with four weeks left to go, it appears that the SPD is in the lead.
The question is though, can they form a coalition that will have a majority of the seats? Right now they could do it by allying themselves with the Greens and the FDP, but as I point out in my article, this coalition would be difficult to arrange as the FDP’s policies are even further to the right than the CDU/CSU. Or they could link up with the Greens and the Left (Linke), if they can get a few independents to go along with them too. That would be a dramatic shift leftwards in German politics.
Today’s market
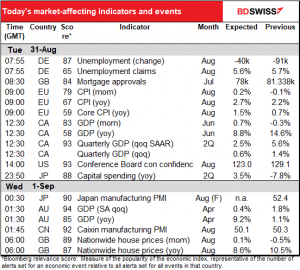
Note: The table above is updated before publication with the latest consensus forecasts. However, the text & charts are prepared ahead of time. Therefore there can be discrepancies between the forecasts given in the table above and in the text & charts.
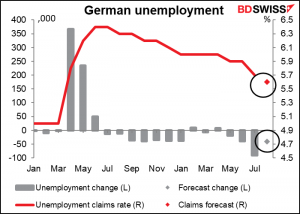
German unemployment is expected to improve. Although the number of unemployed isn’t expected to fall by as much as it did last month, the unemployment rate is forecast to decline. This could be modestly EUR-positive.
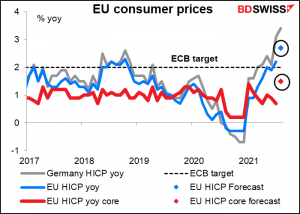
The EU-wide consumer price index (CPI) is forecast to rise sharply on a yoy basis. As I mentioned yesterday, a lot of this will be because of the distortion caused by Germany cutting its VAT in July 2020.
Yesterday’s EU-harmonized German CPI was exactly in line with market expectations at +3.4% yoy, up from +3.1% in July.
Canada’s GDP is forecast to be up 0.7% mom, which would surprise no one as that was Statistics Canada’s preliminary estimate. Manufacturing activity is still constrained by supply chain disruptions and residential investment likely cooled as the housing market started to cool in Q2. Still, consumer spending on services has risen as restrictions were lifted and life gradually came back to normal — spending on food services jumped 20% in June and appears to have risen further in July.
(See below for how the expected path of Canada’s GDP compares to that of Australia and New Zealand.)
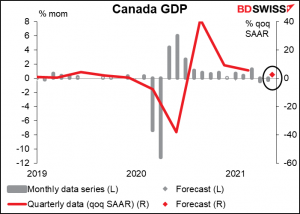
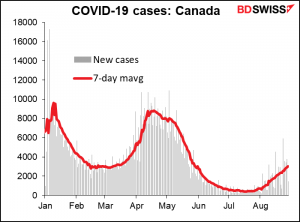
The GDP figures are of course a bit old. The further relaxation of restrictions in July will probably boost that month’s growth rate significantly. But then in late August…
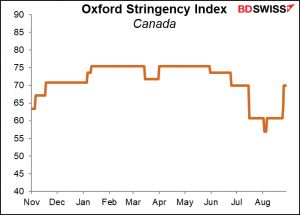
…restrictions were reimposed as virus cases started to rise again.
The US Conference Board consumer confidence index is expected to fall substantially, but nothing like the fall in last week’s U of Michigan consumer sentiment survey, which plunged to the lowest level since Dec 2011, no doubt thanks to fears about the virus.
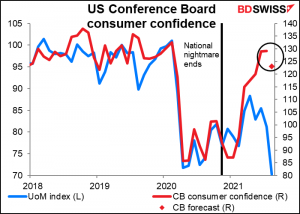
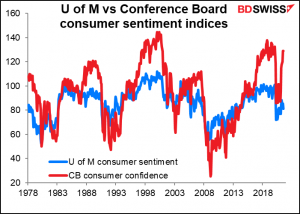
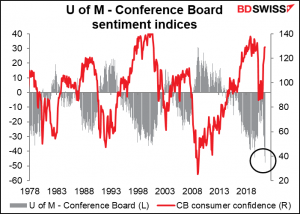
But there’s something else going on here. Why are the two surveys diverging so much? Although the two often diverge on a month-on-month basis – there’s a 60% correlation between the mom changes in the two indices – overall the levels do tend to move together– there’s a 91% correlation there. However, July was the widest gap between the two surveys since the U of M survey started up in 1978. If the forecast for today’s Conference Board indicator is correct, then the gap will be even wider still.
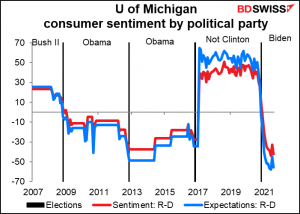
I think part of the reason could be the increasing partisan divide in the US. Republicans are really, really not very happy nowadays. They are even more unhappy than Democrats were when The Former Guy was president, and speaking as a registered Democrat, I can tell you that that was pretty unhappy. But why this should drag one index down more than the other, I have no idea, unless the political composition of their survey pool is different.
Differences in the focus of the survey questions could also account for much of the difference.
The Conference Board’s questions place a greater emphasis on employment and labor market conditions while the U of M’s survey emphasizes individual household finances. As a result, the Conference Board survey more generally reflects consumer feelings towards the overall economy while the U of M survey reflects consumer perceptions of their own personal circumstances. In this case, people may be concerned about the scheduled September expiry of various Federal government unemployment schemes, which about half the states have ended early.
Other differences include the period used for future expectations: the Conference Board uses a six-month period vs the U of M’s one- and five-year expectation outlooks. Additionally, the U of M polls 40% repeat respondents while the Conference Board survey uses a new group of respondents each month.
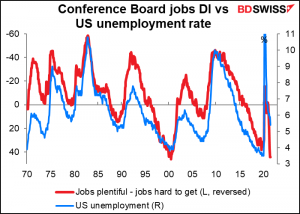
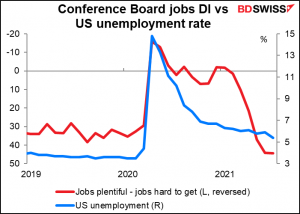
People will also be watching the jobs plentiful vs jobs hard-to-get diffusion index (DI). The Conference Board has a “jobs plentiful” index and a “jobs hard-to-get” index. Subtracting the latter from the former gives a diffusion index of how hard people think it is to find a job, which is a pretty good leading index of the unemployment rate. Last month this DI was at 44.40, not far off its July 2000 record high of 46.20. If this index deteriorates with the expected decline in the overall index, it could suggest trouble down the road for the labor market, which would be a USD-negative development.
Japan capital spending is expected to be up yoy for the first time since before the pandemic began. That’s an improvement, but not a very big one considering how far investment fell (in sum it’s down 8.5% during the last year total vs the previous year). The spread of the virus and worsening corporate earnings are restraining capital investment.

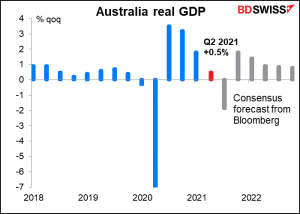
Australia’s Q2 GDP is expected to be up slightly, but given the recent lockdowns, it’s even more dated than usual. As you can see, expectations for Q3 are dismal indeed, thanks to the prolonged lockdown in New South Wales and now also Victoria. Hence I think this figure is of historical interest only, unless perhaps it’s much better than expectations, which could boost hopes for Australia going forward.
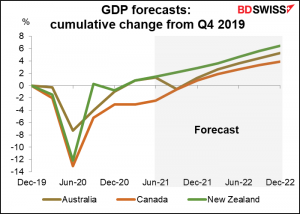
Looking at the three commodity currency countries, Australia and New Zealand both recovered to pre-pandemic levels of output in Q1. Canada isn’t forecast to reach that level until Q4. However, I expect that the Q3 GDP forecast for New Zealand – currently +0.7% qoq – will be revised down sharply due to the lockdown there, which could leave it on a more equal growth path with Australia.
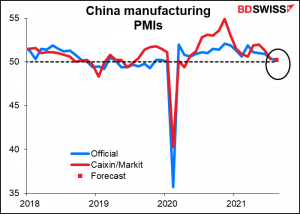
The Caixin/Markit manufacturing PMI for China is expected to be down slightly. This compares with this morning’s official manufacturing PMI, which fell to 50.1 from 50.4 (50.2 expected).
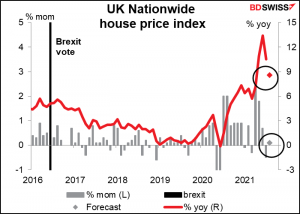
Finally, the UK Nationwide house price index is expected to show just a small rise in house prices from the month before. This is natural as the stamp duty reduction on property purchases was reduced from July 1st. A lot of purchases were brought forward to take advantage of the discount (which eliminated stamp duty on the first GBP 500k of the purchase price) and now it’s natural that the market should cool off somewhat.