Rates as of 05:00 GMT
Market Recap
Markets were generally quiet and cautious ahead of today’s US consumer price index (CPI), which is now The Big Indicator To Watch (more so than even the fabled US nonfarm payrolls).
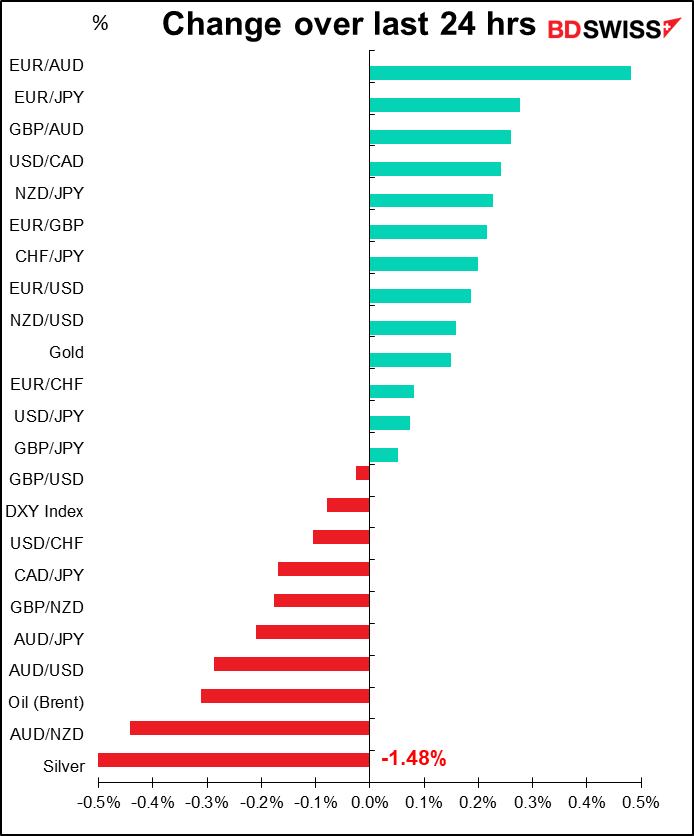
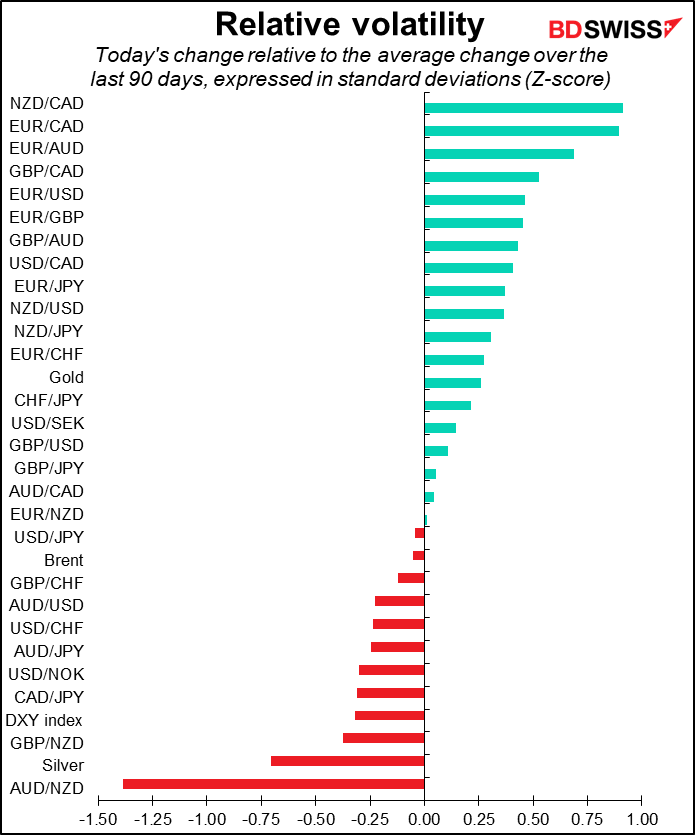
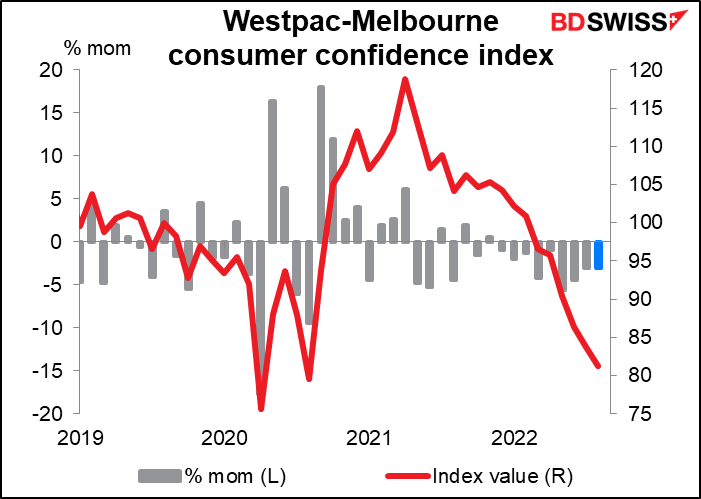
The big mover of the day was AUD/NZD, which had a 1.38-standard-deviation move lower. The fall in AUD was attributed to Tuesday’s Westpac consumer confidence, which fell another 3% month-on-month. Australian consumer confidence has fallen for 9 months in a row now.
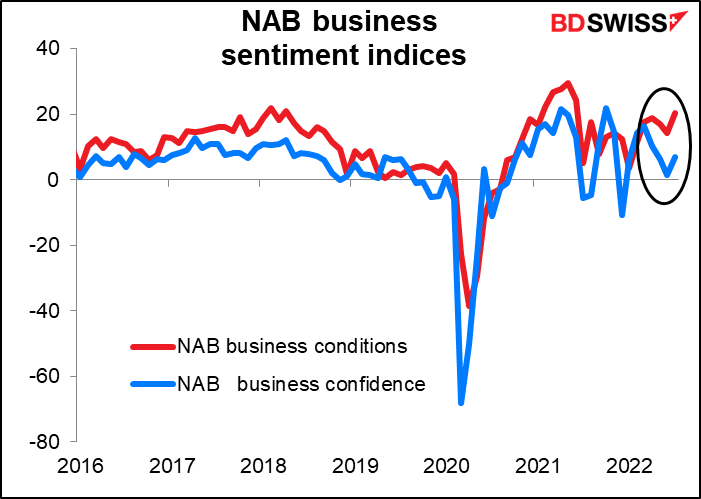
On the other hand, the National Australia Bank (NAB) business sentiment indices rose, with business confidence returning to around its long-term average. Why did one affect the currency so much more than the other? I’m not sure.
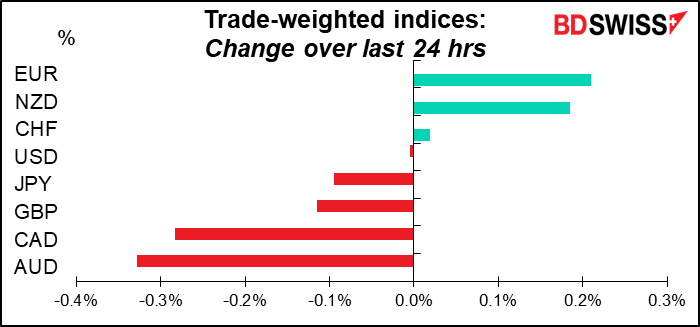
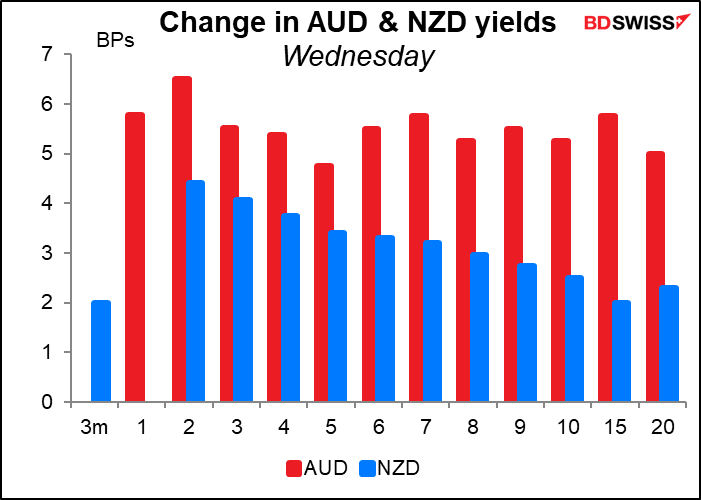
Against that, there was no particular news out for the kiwi. In fact, AUD bond yields moved up more today than NZ bond yields did, which one might normally have thought would support AUD. My assumption would be that people who wanted to sell AUD did it vs NZD, pushing NZD higher. I don’t think there’s any more significance to the move than that.
In any case, the moves are so small that usually I wouldn’t even write about them if there were anything else to write about, but there’s not today.
Speaking of small moves, GBP fell sharply but later recovered much of the decline on reports that the government is making plans for organized blackouts for industry and possibly even households in January when cold weather may combine with gas shortages. “Under the government’s latest “reasonable worst-case scenario,” Britain could face an electricity capacity shortfall totaling about a sixth of peak demand, even after emergency coal plants have been fired up…” Bloomberg reported. “Under that outlook, below-average temperatures and reduced electricity imports from Norway and France could expose four days in January when the UK may need to trigger emergency measures to conserve gas…”
The news caused yields on shorter-dated gilts to rise as it’s expected to mean higher electricity bills this year.

This just adds to the sense of an energy crisis in Europe as French and German power prices for next year continued to rise (2.7% and 1.1%, respectively). There were also reports that Russian oil deliveries through the southern Druzhba pipeline servicing Hungary, Slovakia, and the Czech Republic have been halted since August 4. The pipeline goes through Ukraine and apparently the EU financial sanctions prevent some payments from being made. However, that doesn’t explain why EUR was up on the day.
Today’s market

Note: The table above is updated before publication with the latest consensus forecasts. However, the text & charts are prepared ahead of time. Therefore there can be discrepancies between the forecasts given in the table above and in the text & charts.
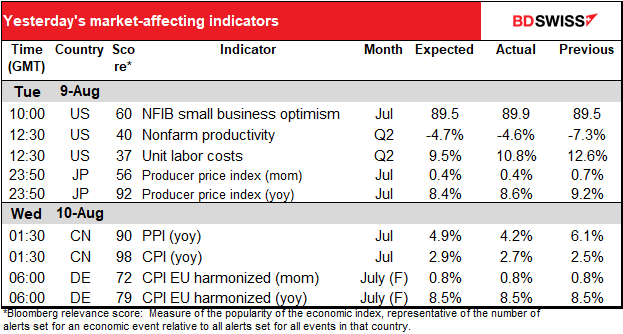
Today’s the big day of the week for the dollar – we get the US consumer price index (CPI). With the Fed’s focus squarely on inflation, there’s no doubt that this is the big one every month nowadays, even if the Fed does pay lip service to the personal consumption expenditure (PCE) deflators as their preferred inflation gauges.
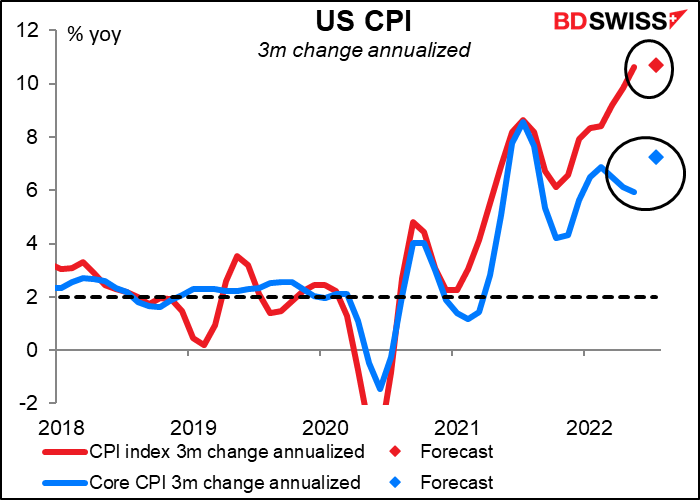
Will this be the month that we can see the light at the end of the tunnel? The headline US CPI is forecast to decline somewhat. Not a lot, but enough that it may spark hopes that inflation has peaked. Core inflation though is forecast to rise a bit, although not back to where it was in March (6.5% yoy).
Note by the way that the Cleveland Fed’s Nowcast forecast for the headline CPI is 8.82% for today’s July figure and 8.76% for next month’s August figure. What that means is that the market may be braced for a higher-than-expected figure and so the surprise from a lower-than-expected figure would be bigger than the surprise from a higher-than-expected figure.

Alas, the data are open to interpretation. The market may perceive this as a turning point, but I doubt if the Committee will. That’s because if we take the forecast three-month change and annualize it, both the headline and the core rate are still going up – the core rate by quite a lot. The decline in the year-on-year rate of increase therefore has more to do with base effects (what was happening a year ago) than with what’s happening today. This may keep officials on their toes.
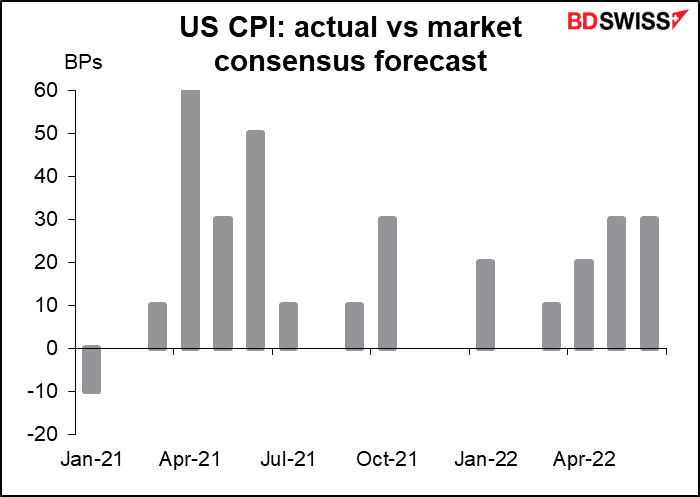
How do the forecasters do? Better than with most indicators, but the bias is clear. Since the beginning of 2021, the market consensus has been right five times – not bad! But the actual figure has exceeded the consensus 12 times and only been below estimates once (and that was in January 2021). In other words, economists have generally been surprised at how high US inflation is.
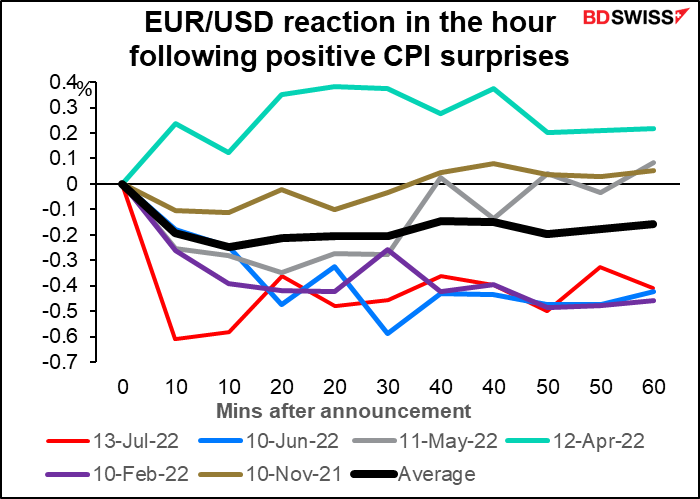
Market reaction: The market reaction to the figures is swift and powerful. It’s especially strong in USD/JPY.

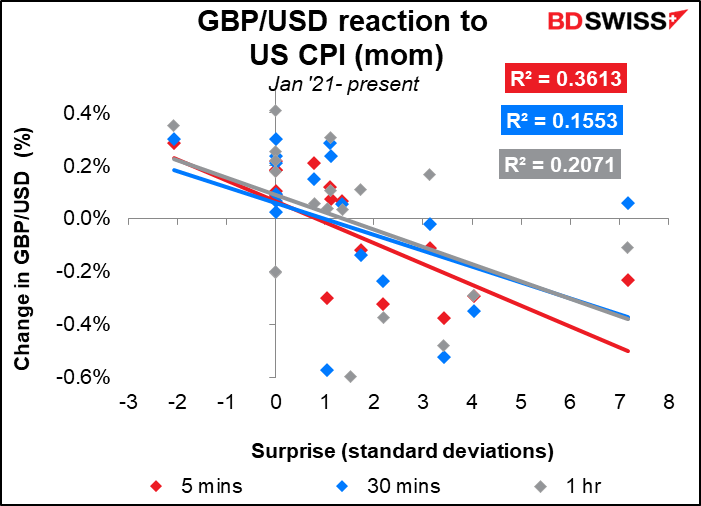
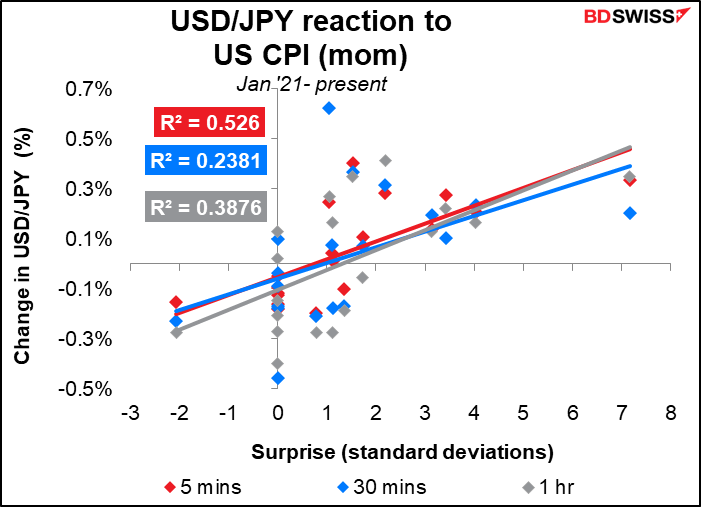
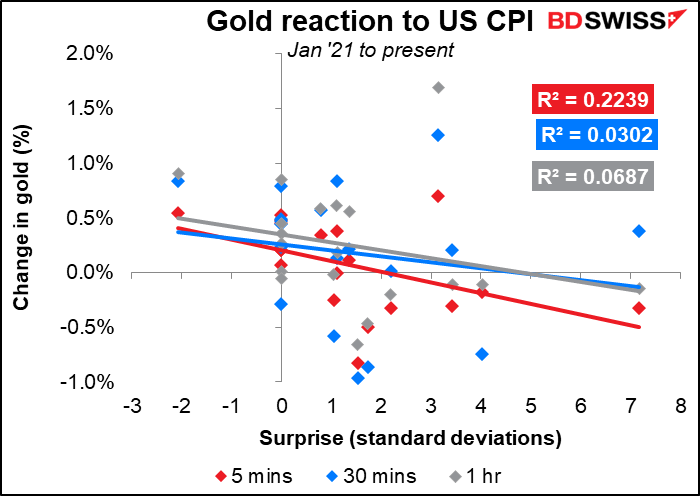
We can see that when the CPI beats estimates, the dollar generally gains – no surprise here.
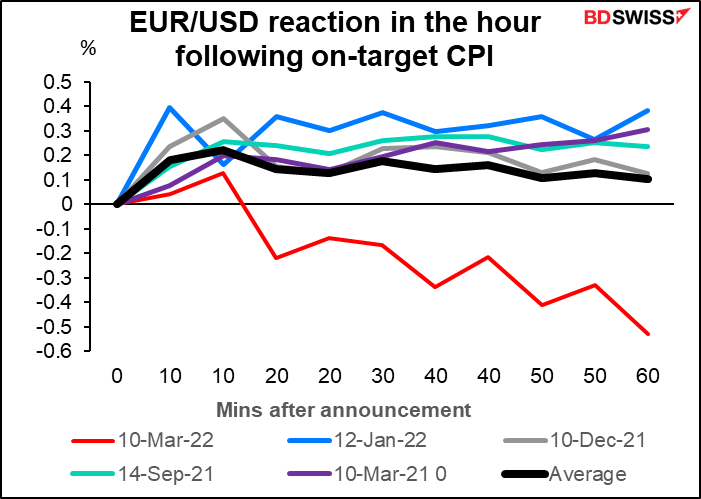
When the market consensus gets it right though the dollar generally weakens. There aren’t enough recent examples to show what happens when the figure misses estimates.
The trend set by the CPI doesn’t always last past the day. Since the beginning of 2021, the movement the following day has been the same 10 times but it’s reversed 9 times, so making it pretty much of a coin toss.

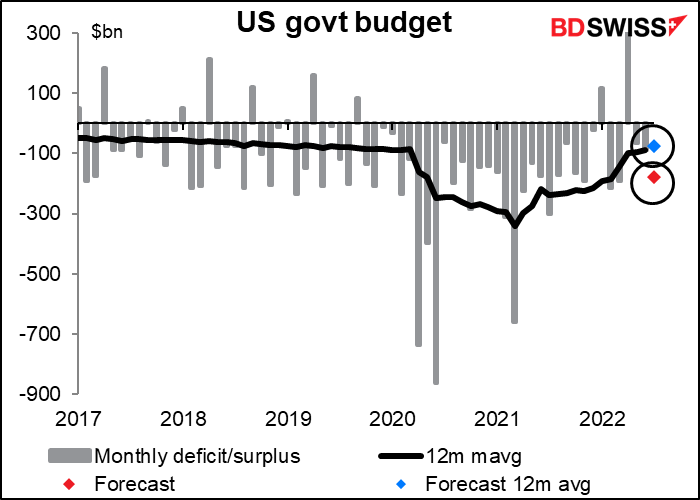
The US budget isn’t particularly market affecting, but I include a graph today just to show you how President Biden is reining in the deficit.
Thursday morning is a holiday in Japan – Mountain Day. Since 88% of the country is covered with mountains, they have good reason to celebrate them.