Rates as of 05:00 GMT
Market Recap
I have been working in the markets since 1979. I lived through the 1987 crash, the pound crashing out of the ERM, the 1998 melt-down of Long Term Capital Management, the 2008/09 Global Financial Crisis, and numerous other crises that I can’t even remember any more.
I have never seen anything like this. That’s not my fault, though — no one has.
Goldman Sachs is saying that US Q2 GDP could be down 24%. Morgan Stanley says -30%. That’s optimistic, according to St. Louis Fed President James Bullard – he says -50%. Unemployment could rise to 30%, higher than in the Great Depression (the peak then was 24.9% in 1933). “This is a planned, organized partial shutdown of the US economy in the second quarter,” Bullard said.
I see no reason to disagree.
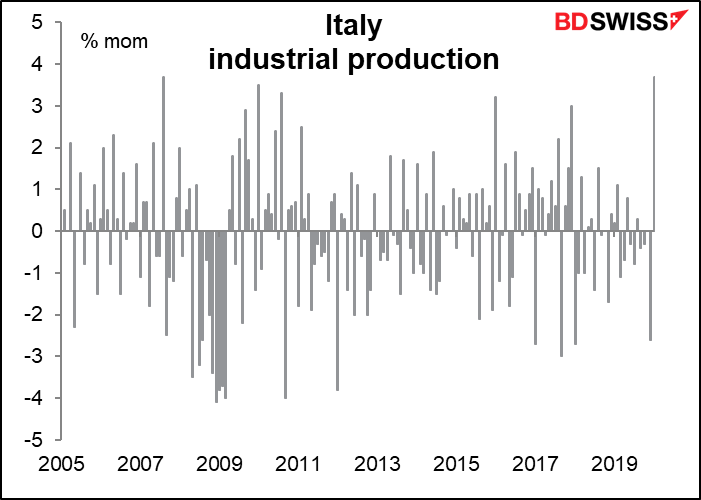
As for GDP, for example, Italy announced that it will shut down almost all industrial production for 15 days. That’s enormous. Even in wartime that doesn’t happen. Italian industrial production should be down 50% mom at least. This for a statistic where 5% would be an enormous move. (In 2008/09 the worst fall was -4.1% mom).
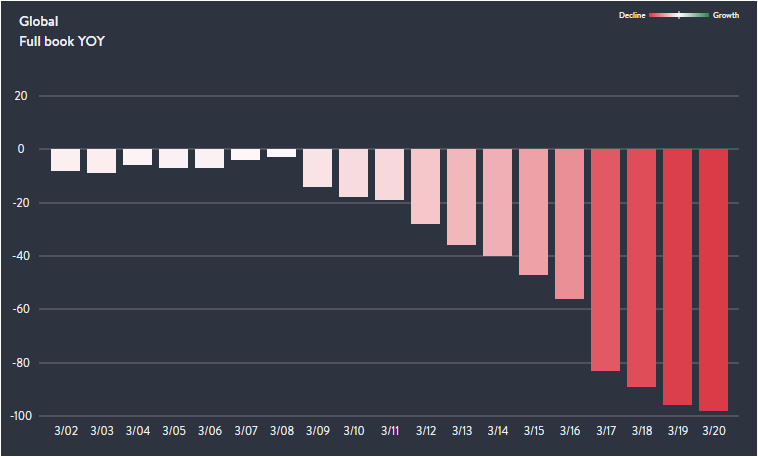
As for employment, Open Table, an online restaurant booking service with websites in several countries, publishes day-by-day data for bookings around the world. Their findings: globally, restaurant bookings are down by 98% yoy in the last few days (see link for the underlying data). There are around 11.5mn people employed in restaurants and bars in the US. That’s 7.5% of the total number of jobs in the country, and their employment is going to zero. That’s just one industry. What about airlines (500k people)? Hotels (1.7mn people)? Etc, etc.
This morning, S&P 500 futures opened. Four minutes later, they shut – limit down. We are likely to see the same thing repeated day after day after day.
The reason for the crash this particular morning is that the US government is unable to come up with a rescue plan. The US Senate gave up trying to negotiate a bipartisan rescue bill on Saturday and the Republicans wrote it alone. It was unable to pass on Sunday.
The problem is that as usual, the Republicans want to stuff it full of goodies for big companies and stiff workers, health care, hospitals and small companies. The bill as the Republicans wrote it would provide $500bn to rescue large companies, even though 83% of employment in the US is with small- and medium-sized companies and only 17% is with the S&P 500s. It would allocate $50bn to help the airline industry, which spent 96% of its free cash flow buying back stock while simultaneously turning air travel into the hell-in-a-metal-tube experience that everyone hates. Most egregious of all, the bill as presented would allow the Treasury Secretary to withhold the names of businesses and governments that received the assistance for six months. That means the government could shovel money to, say, Trump-owned hotels without anyone knowing about it.
Debate continues and there will be more votes. The attempt to forge a rescue package in the US is going to be the main point to watch today.
The worsening political and economic situation in the US is simply the other side of the worsening medical situation. Here’s a graph of the number of virus cases in the US compared to those in China, with the start of the graph being the day that there were 500 cases. The US is now where China was on 5 February. Wuhan was locked down on 23 January. There are restrictions in some places in the US, but no nationwide lockdown, and I doubt if US citizens would go along with one anyway. They are just too focused on their rights and not enough on their responsibilities.

By contrast, we are seeing a slowdown in the spread of the virus in parts of Europe. Italy, the hardest-hit country, is seeing a decline in the rate of growth.
Some people have pinned their hopes on the change in the seasons. Usually, the flu season dies down when the warm weather begins, because the flu virus can’t survive as well in the heat. Well, Thailand just reported 122 new coronavirus cases, bringing the total there to 721. FYI it’s 35 degrees Centigrade there right now.
The question I had is, why is the dollar strengthening so much when the US’ response to the virus is the worst anywhere and the country is likely to be hardest hit among the developed economies? And the answer is surprisingly simply. As an article on Bloomberg explains,
While the euro has increasingly become a funding currency in its own right, the dollar’s outsized role continues. Total dollar credit extended to borrowers, excluding banks, climbed to a record $12.1 trillion by last September, Bank for International Settlements data show. That’s more than double the level a decade before. It amounted to almost 14% of global GDP; the ratio back in 2009 was under 10%.
This dollar debt amounts to a huge short position in dollars. That is, people outside the US have borrowed huge amounts of dollars and are now having to refinance those positions. But at the same time, many borrowers with bank credit lines are drawing down those credit lines, which uses up banks’ balance sheets and constrains their ability to lend. The result is that the banking system simply doesn’t have enough dollars to lend to everyone who wants to borrow them now. That’s why there’s a global scramble for dollars.
It’s like back in 2008. The US was the epicenter of the collapse of house prices and all the toxic financial structures built on that bubble. Yet the dollar strengthened during that crisis.
I expect that eventually this dollar short will be filled with the help of the Fed’s swap lines. At that point, the dreadful response of the US government and the devastation caused by the disease in the US will become the dominant factor and the dollar is likely to decline. But for now, it seems that the demand for the US currency is temporarily insatiable.
Today’s market movements
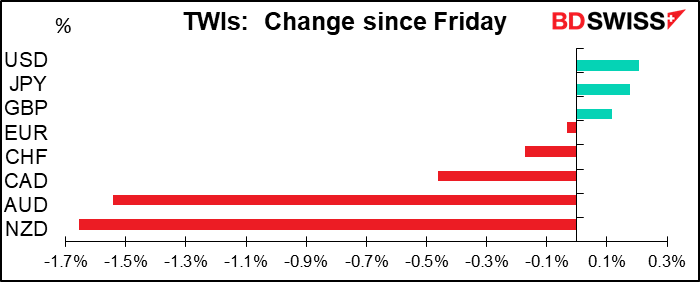
OK, getting back to today’s FX market: NZD and AUD were the big losers after the two governments announced lockdown measures. Australia is shutting down pubs and restaurants, while New Zealand will go into nationwide lockdown: everyone will be required to go into self-isolation and all non-essential businesses will close for at least four weeks.
To support the economy during this time, the Reserve Bank of New Zealand (RBNZ) announced an NZD 30bn quantitative easing program, just one week after an emergency rate cut and liquidity measures. NZD 30bn is enormous: 10% of GDP! By comparison, the outstanding stock of NZ government debt is NZD 81bn.
While these measures hit those countries’ currencies today, I don’t think the actions are unique. I think this is just a hint of what’s coming from most countries. In that case, other currencies are just waiting their turn.
Oil had another bad day. On Friday, the head of the Texas Railroad Commission, which despite its name regulates the Texas oil industry, was invited to attend OPEC’s June meeting. That raised the previously unthinkable possibility that the US might cooperate with OPEC+ to hold down oil production. However, the idea was quickly squashed as other officials and industry executives scorned it. I at least give them credit for holding to their free-market principles in the face of a test like this.
Commitments of Traders (CoT) report
Huge percentage moves, but that’s because net positioning is so small.
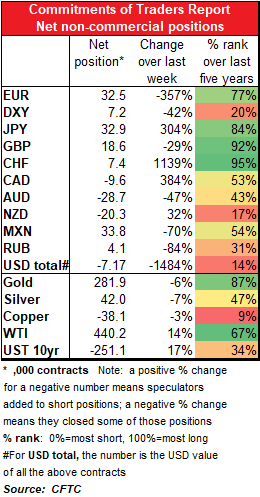
It seems that as of last Tuesday, when the data were taken, traders weren’t really on the USD bandwagon yet. Their biggest mistake: they flipped from -12.7k contracts short in EUR to +32.5k contracts long. OOPS! Because of that, the overall USD positions flipped into net short. They also cut their already small DXY longs. I can see those being corrected ASAP.
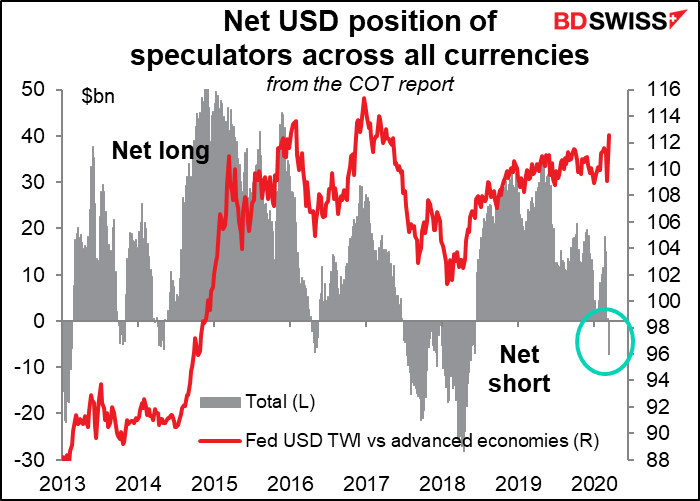
They cut their GBP longs and added to some commodity currency shorts (CAD and NZD) and JPY longs, but they cut their AUD shorts, which was a mistake. All told, not that consistent a picture.
They trimmed both gold and silver longs, but remain substantially long gold.
A word about indicators in the coming weeks and months
There are very few indicators on the schedule today. That gives me some space to discuss the indicators coming out over the coming weeks and months.
The major industrial countries have never been in this situation before and so we have (almost) no idea what will happen.
I say “almost” no idea because we can get some idea from China and South Korea, countries where they’ve already been through what we’re going to go through from here.
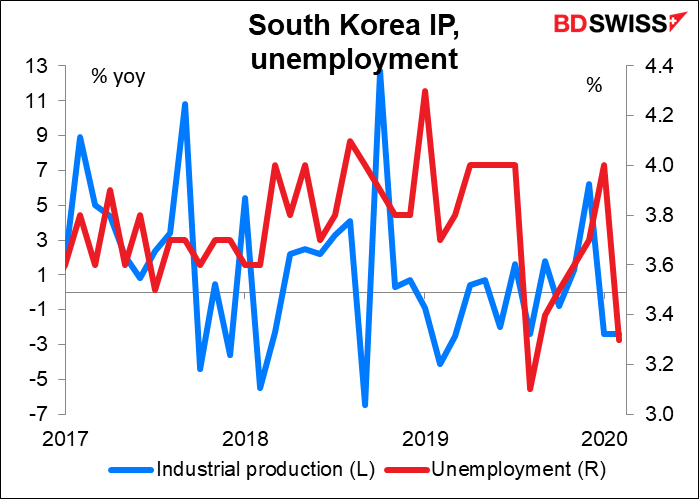
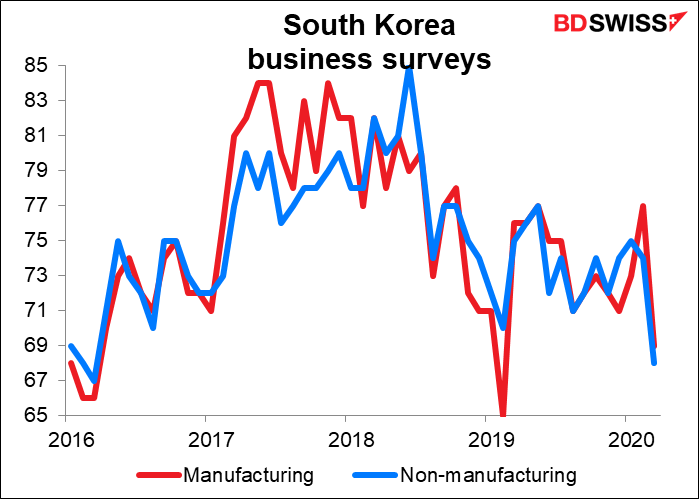
South Korea’s indicators have been relatively normal so far, much to my surprise. Unemployment actually fell in February and the Bank of Korea’s business surveys have been well within the normal range.
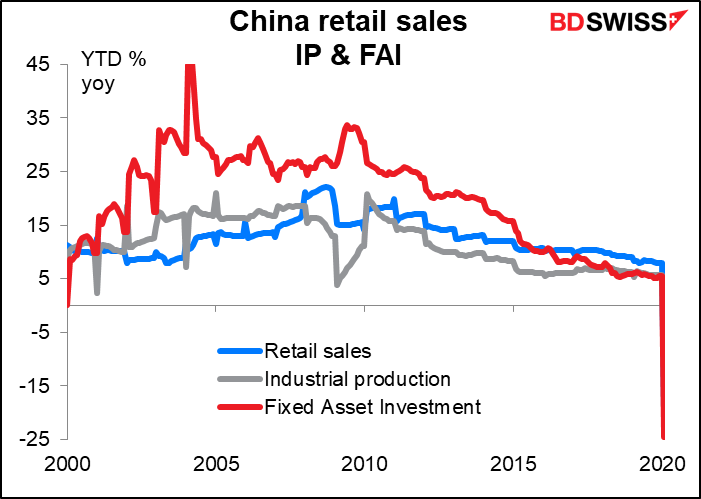
But China…wow! We’ve seen things we’ve never seen there before. Plunging retail sales (-21% yoy), industrial production (-13.5% yoy) and investment (-25%) – series that have never had a yoy decline in the 20-25 years they’ve been issued.
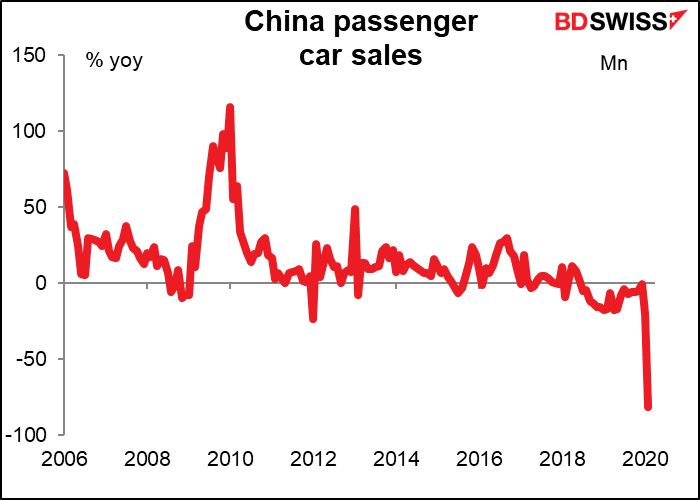
Car sales were down 82% yoy. In China, nothing is down 82% yoy. Ever. In fact, normally nothing is even down yoy at all! (well, almost nothing). Remember, it’s simple math but nothing can fall more than 100%. Down 100% means nothing was produced.
We’re beginning to see the same thing in some high-frequency data out of the US and elsewhere. As mentioned above, the Open Table data series shows a total collapse of restaurant bookings. Expect more such figures as countries go into total lockdown.
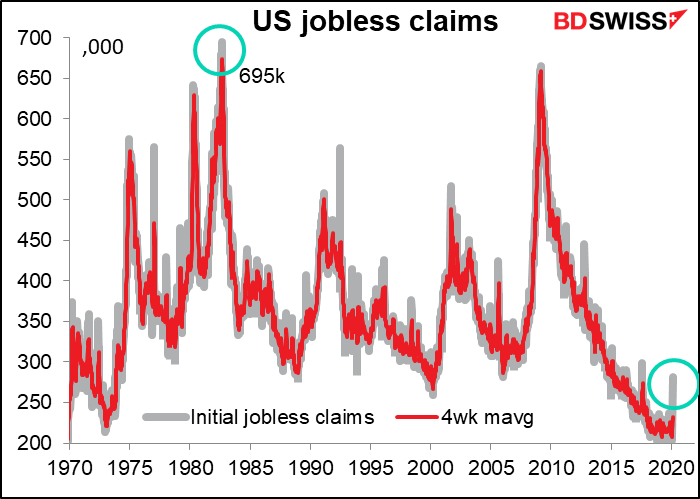
In the US, attention will focus on two high-frequency data series. The most high-profile one will be the weekly jobless claims out every Thursday. Claims skyrocketed in the latest reporting week (to 14 Mar) to 281k from 211k, but that’s nothing compared to what’s expected for the week ended 21 Mar: 1500k. That would be more than double the previous peak of 695,000 set in October 1982. Of course the labor force is a lot bigger now (+40%) but the headlines probably won’t mention that fact.
The other high-frequency data to watch is US government tax receipts. This is available daily. It’s incredibly volatile data though, so it needs a lot of massaging to make a trend visible. Suffice it to say that the red line is a heavily massaged year-on-year change in the figures, and the blue line is a moving average of that trend.
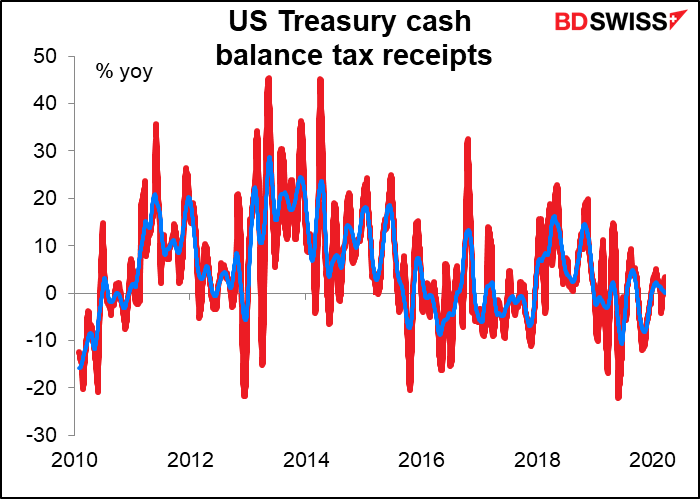
The moving average seems to move along with the Institute of Supply Management’s manufacturing purchasing managers’ index (ISM PMI). We can watch this indicator on a daily basis, although the day-to-day fluctuations are so great even in normal times that it will take some time to discern a change in trend.

I’m going to continue to give the market estimate for these indicators and draw these pretty little graphs, but frankly it’s not going to mean a whole lot. For many series, there will simply be no way to guess estimate what the actual number is. The usual correlation between Series X and Series Y, or last month’s data and this month’s data, will be distorted if not destroyed. The technical term for this is “a break in the data.” We really have no idea what’s coming at us.
That’s not to say it’s pointless. People will be guessing, and those guesses will help to shape the market’s expectations. We can still track whether reality is better or worse than those expectations through economic surprise indices. These are statistics that track the difference between the market consensus forecasts for indicators and the actual results. I’ll be tracking those as well to see just how much worse things are than people imagine.
Today’s indicators
Today there aren’t many indicators out, and the ones that are out are going to be fairly meaningless.
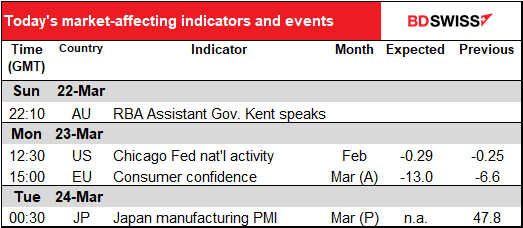
When the US starts up, we get the Chicago Fed National Activity Index (CFNAI). It’s different from the other regional Fed indices. It’s designed to gauge overall economic activity and related inflationary pressure on a national basis, not regional. The key point this time though is that a) it’s a month behind everything else (it’s for January) and b) it’s comprised of 85 components that have all been previously announced. So it’s well behind the times and can only tell us where the US was standing when it jumped off the cliff and not how far down it is to the bottom.

Eurozone consumer confidence is expected to fall, but to remain well above levels hit during the Greek debt crisis. But back then, the worst that could happen was that the euro might break up. Now, people are worried about dying. What’s April’s figure going to look like?
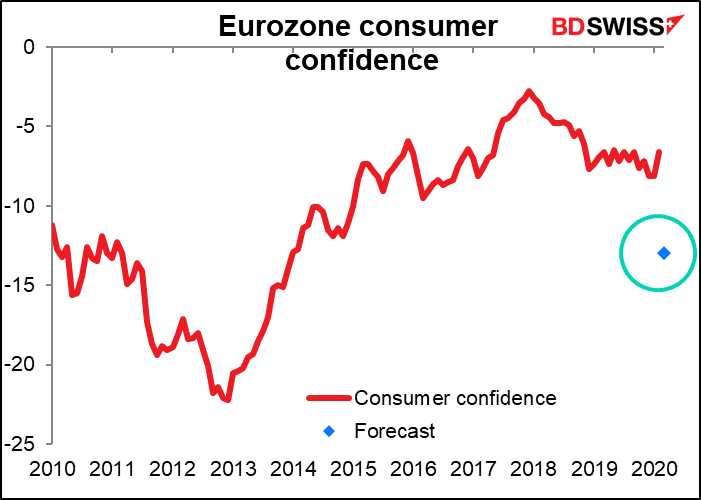
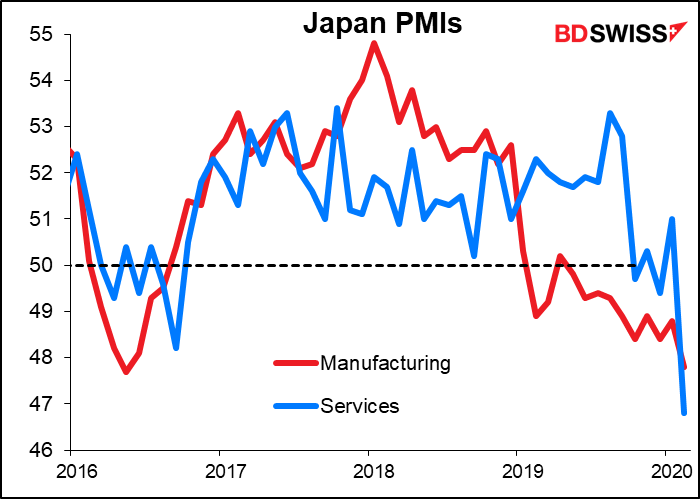
Then overnight we start getting the initial estimates of the Markit purchasing manufacturers’ indices (PMIs) for the major industrial countries. Japan as usual starts off, but economists don’t forecast the Japanese PMI. In any case, they were bad last month and they’re likely to be terrible this month.
