Previous Trading Day’s Events (28.08.2024)
Australia Monthly CPI Indicator: Australia’s CPI rose 3.5% YoY in July 2024, slightly above market expectations of 3.4%, with easing housing (4.0%) and transport prices (3.4%), driven by falling electricity (-5.1%) and fuel costs (4.0%). Food inflation spiked to 3.8%, while core inflation hit 3.7%, remaining above the RBA’s 2-3% target.
Winners Vs Losers In The Forex Market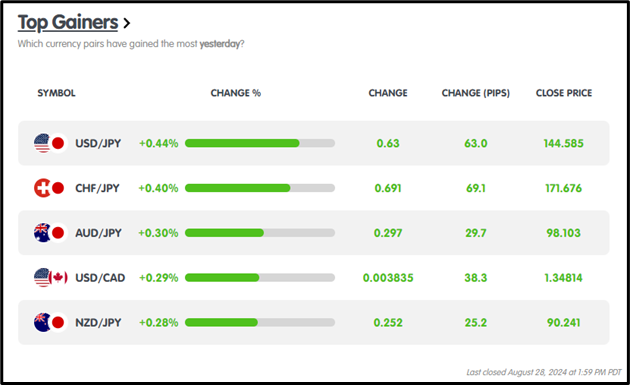
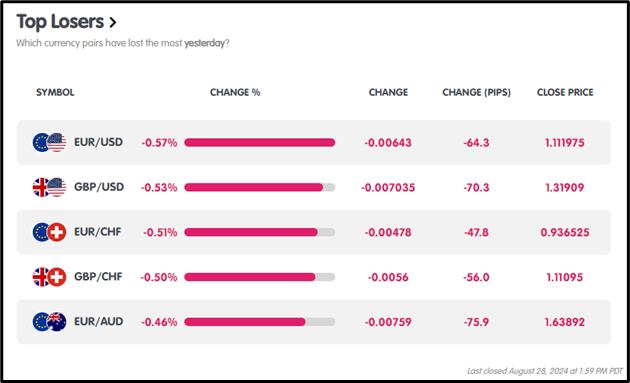
On August 28, 2024, USD/JPY led the gainers with a +0.44% rise, adding +63.0 pips, while EUR/USD was the top loser, dropping -0.57% and losing -64.3 pips.
News Reports Monitor – Previous Trading Day (28.08.2024)
Server Time / Timezone EEST (UTC+03:00)
Tokyo Session:
Bullish AUD following Australia’s CPI release at 1:30 am GMT, with a 3.5% YoY rise in July, exceeding the 3.4% forecast.
London Session: No significant news
New York Session: No significant news
General Verdict :
The Tokyo session saw a bullish AUD response to Australia’s CPI exceeding expectations, with no significant developments in the London and New York sessions to shift market momentum.
FOREX MARKETS MONITOR
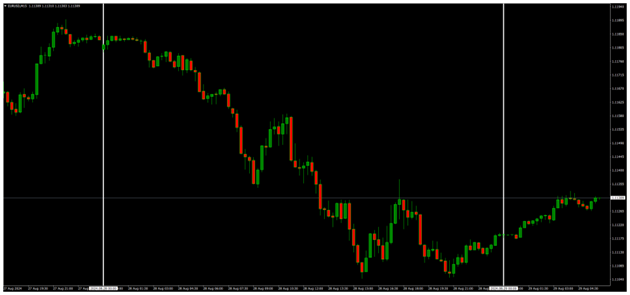
EURUSD (28.08.2024) 15m Chart Summary
Server Time / Timezone EEST (UTC+03:00)
Price Movements
EUR/USD experienced a bearish trend, opening at 1.11795 and closing lower at 1.11177, with a daily low of 1.11033 and a high of 1.11843.
 CRYPTO MARKETS MONITOR
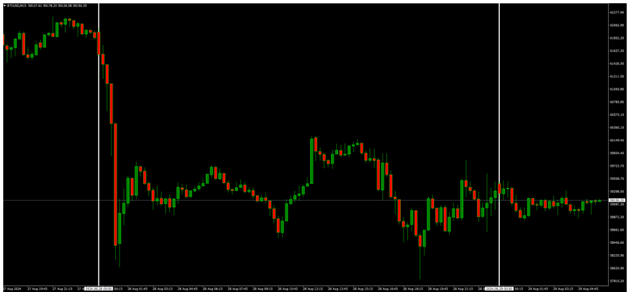
BTCUSD (28.08.2024) 15m Chart Summary
Server Time / Timezone EEST (UTC+03:00)
Price Movements
BTC/USD followed a bearish trend, opening at $61,956.41 and closing at $59,274.56, with the day’s low hitting $57,832.06 and the high reaching $61,956.57.
 STOCKS MARKETS MONITOR
NVIDIA (28.08.2024) 15m Chart Summary
Server Time / Timezone EEST (UTC+03:00)
Price Movements
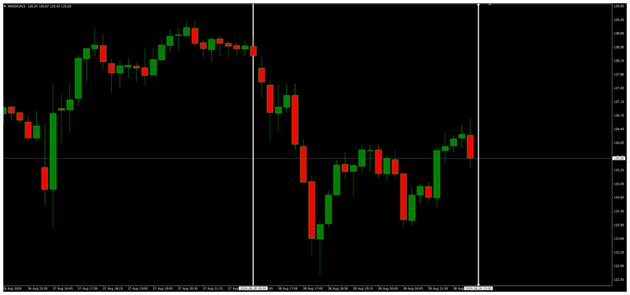
Nvidia showed a bearish trend, opening at $127.97 and closing lower at $125.65, with an intraday low of $122.59 and a high of $127.99.
 INDICES MARKETS MONITOR
NAS100 (28.08.2024) 15m Chart Summary
Server Time / Timezone EEST (UTC+03:00)
Price Movements
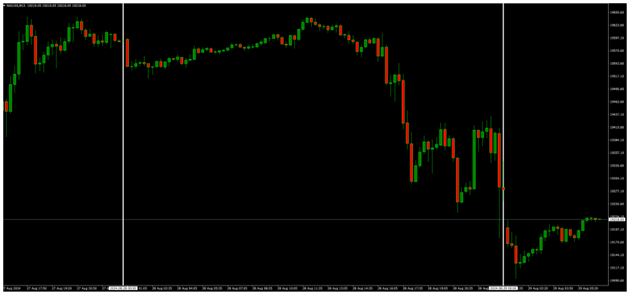
The NAS100 experienced a bearish session, opening at 19,598.80 points and closing lower at 19,216.30 points, with an intraday low of 19,172.78 and a high of 19,641.05 points.
 COMMODITIES MARKETS MONITOR
XAUUSD (28.08.2024) 15m Chart Summary
Server Time / Timezone EEST (UTC+03:00)
Price Movements
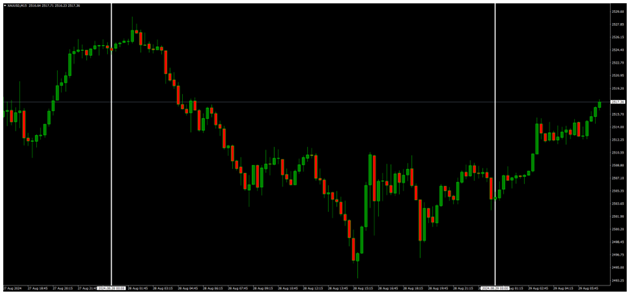
XAU/USD exhibited overall bearish momentum, opening at $2525.06 and reaching an intraday high of $2529.08 before closing lower at $2504.26, with $2493.39 as the session low.
News Reports Monitor – Today Trading Day (29.08.2024)
London Session: No Significant News
New York Session:
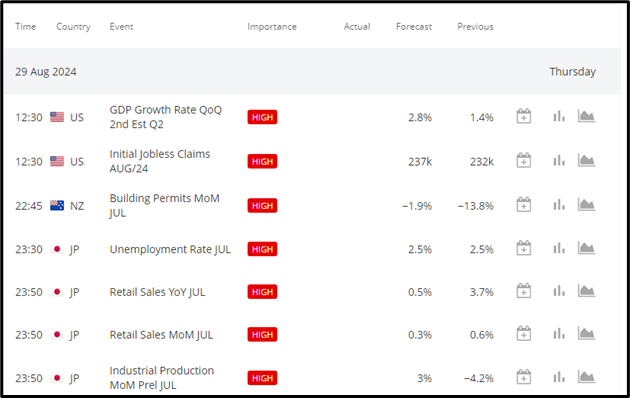
12:30 (US): GDP Growth Rate Q2, Forecast: 1.4%. A stronger-than-expected GDP boosts USD.
12:30 (US): Initial Jobless Claims, Forecast: 237k. Stable employment data supports USD stability.
Tokyo Session:
22:45 (NZ): Building Permits (MoM), Forecast: -13.8%. Less contraction than forecast could lift NZD.
23:30 (JP): Unemployment Rate, Forecast: 2.5%. In-line unemployment stabilizes JPY.
23:50 (JP): Retail Sales (YoY), Forecast: 3.7%. Weaker retail sales may weigh on JPY.
23:50 (JP): Retail Sales (MoM) , Forecast: 0.6%. Slower sales growth is bearish for JPY.
23:50 (JP): Industrial Production (MoM Prelim), Forecast: -4.2%. Stronger production supports JPY.
Source
https://km.bdswiss.com/economic-calendar/
Metatrader 4 ( MT4 )


