Previous Trading Day’s Events (19.04.2024)
“What is clear is that the first quarter of the year has been disappointing for many retailers,” said Lisa Hooker, leader of industry for consumer markets at PwC. “Lower inflation and the first 2% cut to National Insurance, which was felt in January’s pay packets, has yet to translate into a sustained recovery in spending.”
Source:
https://www.reuters.com/world/uk/uk-retail-stagnated-again-march-ons-says-2024-04-19/
______________________________________________________________________
Winners vs Losers
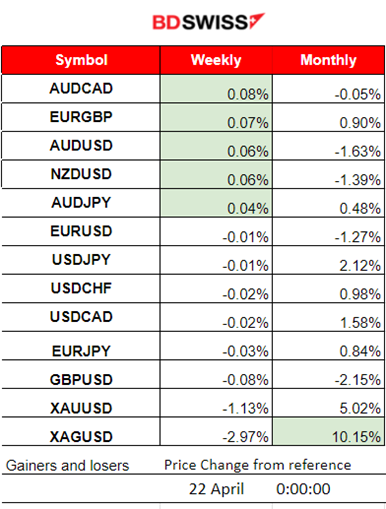
A new week starts with AUDCAD at the top and with 0.08% gains. Silver remains the top performer for the month with 10.15% gains so far. USD remains stable.
 ______________________________________________________________________
News Reports Monitor – Previous Trading Day (19.04.2024)
Server Time / Timezone EEST (UTC+03:00)

- Midnight – Night Session (Asian)
Israel launched an attack on Iran, US officials said. US officials said overnight that an Israeli missile struck Iran in the city of Isfahan in central Iran while Iranian media also reported explosions.
Source:
https://uk.news.yahoo.com/live/iran-israel-attack-missile-live-news-war-064111345.html
Israel has not officially commented on the attack, while Iran downplayed the reports.
Israel will defend itself, Netanyahu says, as the West calls for restraint.
Source:
Many asset categories were affected including commodities.
- Morning – Day Session (European and N. American Session)
At 9:00 the monthly retail sales report of the U.K. showed that Retail sales volumes (quantity bought) were estimated to be flat (0.0%) in March 2024, following an increase of 0.1% in February 2024 (revised from 0.0%). The market reacted with GBP appreciation during that time and the effect has not faded yet.
General Verdict:
 __________________________________________________________________
FOREX MARKETS MONITOR
EURUSD (19.04.2024) 15m Chart Summary
Server Time / Timezone EEST (UTC+03:00)
Price Movement
The pair started to drop early as the Israel attack news came up. Later the pair moved to the upside as the USD started to weaken. No major volatility was recorded or shocks since there was an absence of significant news and schedule figures. After reaching resistance at near 1.06780, EURUSD reversed to the downside and stayed close to the intraday 30-period MA at the 61.8 Fibo level.
 ___________________________________________________________________
CRYPTO MARKETS MONITOR
BTCUSD (Bitcoin) Chart Summary 1H
Server Time / Timezone EEST (UTC+02:00)
Price Movement
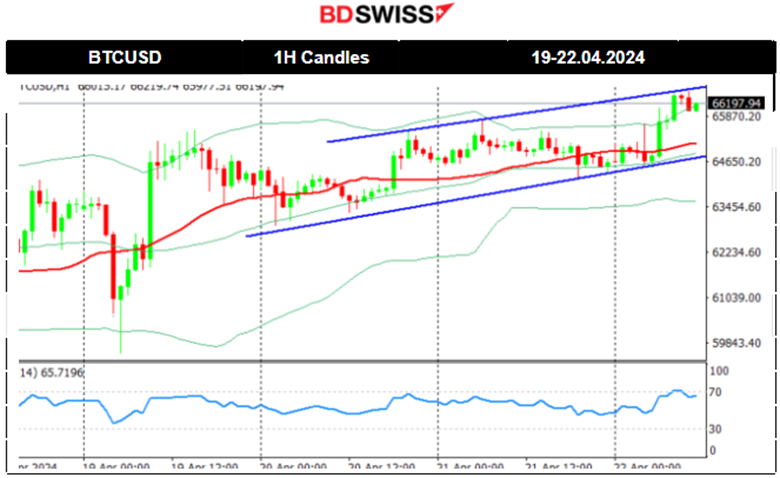
Bitcoin halving took effect late on Friday 19th April, cutting the issuance of new bitcoin in half. It happens roughly every four years, and in addition to helping to stave off inflation, it historically precedes a major run-up in the price of Bitcoin.
Its price started slowly to move to the upside and experienced an uptrend during the weekend with 66K USD being the critical resistance level for now.
Source: https://www.cnbc.com/2024/04/21/bitcoin-miners-get-into-ai-to-survive-halving.html
 Crypto sorted by Highest Market Cap:

The market seems to have picked up traction as the Bitcoin halving took place. Despite the event, it’s unclear whether it will lead to a price jump as it has in the past.
Source: https://www.investing.com/crypto/currencies
______________________________________________________________________
EQUITY MARKETS MONITOR
S&P500 (SPX500) 4-Day Chart Summary
Server Time / Timezone EEST (UTC+03:00)
Price Movement
After a period of consolidation, on the 17th of April, it broke the support at 5,040 USD and moved lower to the next support at 5,000 USD before retracing. On the 18th of April, the market remained below the 30-period MA but a breakout did not occur. The breakout of the 5,000 USD level eventually caused a sharp drop on the 19th of April as mentioned in our previous analysis. Volatility levels dropped until the end of the day and week with an apparent triangle formation in place. It seems that on the SPX500 the critical resistance is at 5000 USD. The index was on a downtrend recently as borrowing costs are expected to remain high, plus geopolitical tensions having an impact on expectations and a change to a risk-off mood. Breakout to the upside could lead to a jump of 130 USD while a breakout of the triangle to the downside can lead to the reach of the depicted support levels below.
 ______________________________________________________________________
COMMODITIES MARKETS MONITOR
USOIL (WTI) 4-Day Chart Summary
Server Time / Timezone EEST (UTC+02:00)
Price Movement
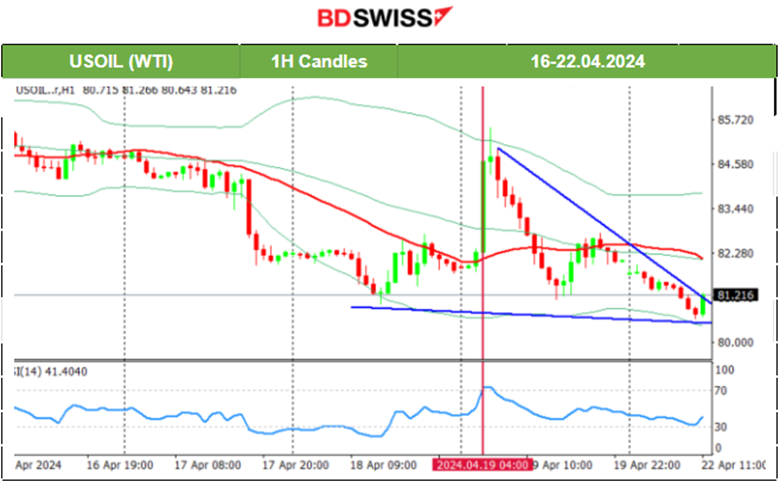
Since the 16th of April, the market has shown that volatility lowers and this was the cause of a triangle formation to appear. A breakout occurred on the 17th of April eventually causing the drop of the price to 82 USD/b. On the 18th of April, the price broke the support end and reached the next support at 81 USD/b before retracement took place. On the 19th of April the news regarding the Israel attack in Iran, caused the commodity prices (Gold and Oil) to jump but only to reverse soon after fully. Currently, lower volatility levels form a triangle formation, and a breakout to the upside (which is possible considering the apparent bullish divergence) could lead the price to reach the 83.5 USD resistance. The 50-period Bollinger Band’s upper band supports the possible next target resistance to be at that level.
 XAUUSD (Gold) 4-Day Chart Summary
Server Time / Timezone EEST (UTC+03:00)
Price Movement
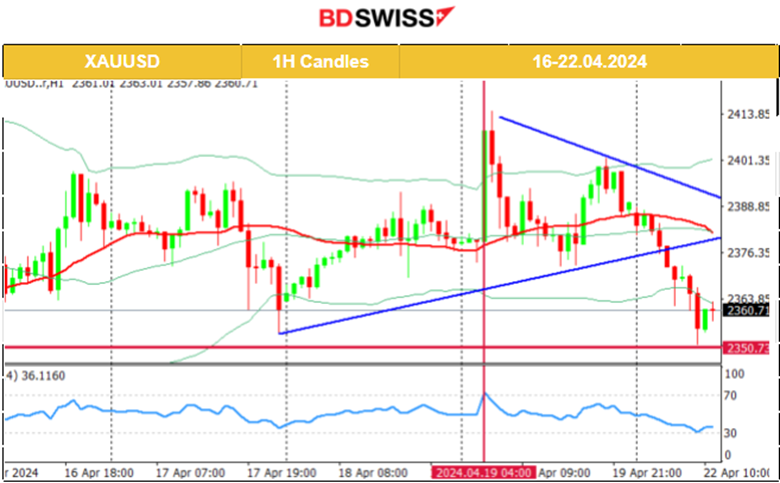
On the 17th of April Gold moved lower as it broke the apparent upward wedge formation reaching the intraday support at 2,355 USD/oz before returning to the 30-period MA. On the 18th of April, Gold stayed in range, flirting with the 2,390 USD/oz at some point but remaining close to the MA. On the 19th of April the news regarding the Israel attack in Iran, caused the commodity prices (Gold and Oil) to jump but only to reverse soon after fully. Gold retreated eventually lower reaching the support at 2,350 USD/oz and it is estimated to continue sideways.
 ______________________________________________________________
News Reports Monitor – Today Trading Day (22 April 2024)
Server Time / Timezone EEST (UTC+03:00)

- Midnight – Night Session (Asian)
No special news announcements, no major scheduled figure releases.
- Morning – Day Session (European and N. American Session)
No special news announcements, no major scheduled figure releases.
General Verdict:
______________________________________________________________


