Previous Trading Day’s Events (29 Nov 2023)
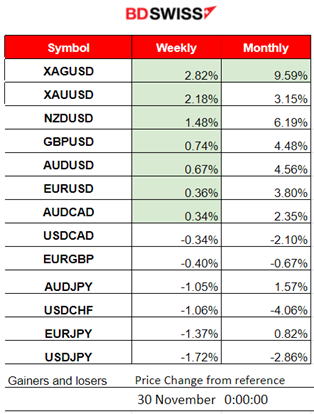
The RBNZ kept the official cash rate (OCR) at 5.5% as expected, but the hawkish tone of the statement caused a surprise and the aforementioned effect on the NZD.
“If inflationary pressures were to be stronger than anticipated, the OCR would likely need to increase further,” it said in a statement. New Zealand’s annual inflation has come off in recent quarters and is currently 5.6%, with expectations that it will return to its target band by the second half of 2024.
“Interest rates will need to remain at a restrictive level for a sustained period of time so that consumer price inflation returns to target and to support maximum sustainable employment,” the statement said.
______________________________________________________________________
Winners vs Losers
 ______________________________________________________________________
News Reports Monitor – Previous Trading Day (29 Nov 2023)
Server Time / Timezone EEST (UTC+02:00)
- Midnight – Night Session (Asian)
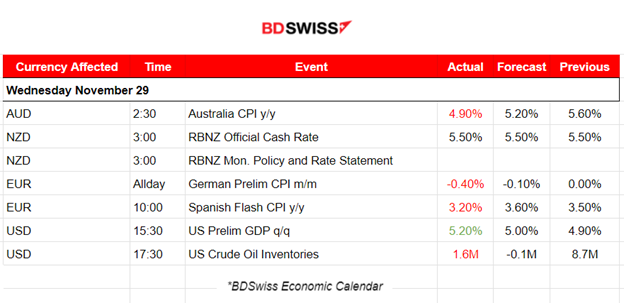
Australia’s inflation rate seems to have been significantly lowered. The report released at 2:30 showed that the consumer price indicator rose 4.9% from a year earlier, the first reading for the fourth quarter and lower than economists’ estimate of 5.2%. At the time of the release, the AUD depreciated against other currencies, but not significantly during that time as the effect of the report soon faded.
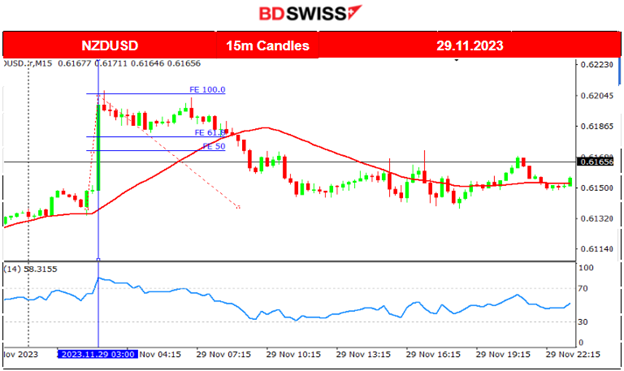
At 3:00, the Reserve Bank of New Zealand decided to keep the official Cash Rate at 5.5% but stated that hikes might not be over. Policymakers are confident that high interest rates are restricting spending in the economy and inflation is declining as necessary. However, inflation remains too high, still at an annual rate of 5.6%, which is now higher than the UK’s inflation rate. At the time of the announcements, the NZD appreciated greatly and rapidly. The NZDUSD jumped nearly 60 pips before retracing to the mean soon after.
- Morning–Day Session (European and N. American Session)
Germany’s preliminary monthly CPI change figure was reported surprisingly negative and more negative than expected, signalling that German inflation dropped further and that the disinflation trend in Germany has gained more momentum. The Spanish Flash CPI yearly change figure also showed a lower figure of 3.2% versus the expected 3.60% figure. We see significantly lower numbers in inflation-related data for the big economies in the Eurozone. Generally, the EUR lost value against the USD yesterday but no major shocks were observed at the time of the report releases.
The Real gross domestic product (GDP) for the U.S. increased at an annual rate of 5.2% in the third quarter of 2023. This was higher than the expectation. Higher GDP is good for the economy, although it complicates things a bit for the Federal Reserve, which has been raising interest rates. The Fed expects that demand cools off with hikes so prices fall, but the hot GDP reading shows that economic growth is resisting the fall.
General Verdict:
 ____________________________________________________________________
FOREX MARKETS MONITOR
EURUSD (29.11.2023) Chart Summary
Server Time / Timezone EEST (UTC+02:00)
Price Movement
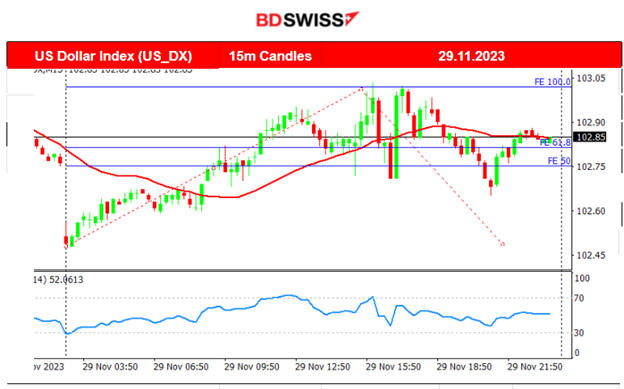
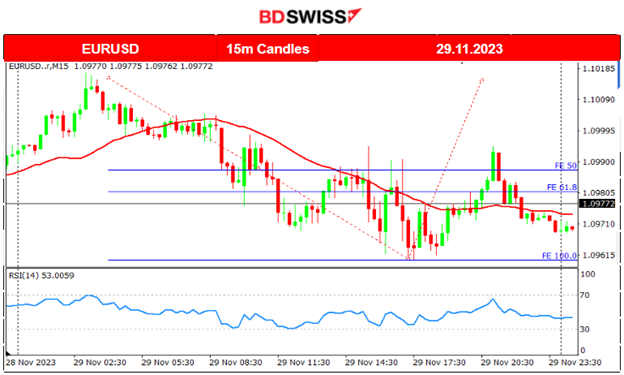
The pair moved lower to the downside early during the Asian session and remained for a long period of time below the 30-period MA until the start of the N.American session. In general, it moved with low volatility. The inflation-related news regarding Germany and Spain has kept the EUR weak while the USD gained more strength due to the fact that growth in the U.S. is still strong according to the reports.
NZDUSD (30.11.2023) Chart Summary
Server Time / Timezone EEST (UTC+02:00)
Price Movement
The pair experienced a jump at the time of the RBNZ OCR and Monetary policy report release. It retraced back to the mean soon after the release at 3:00 and kept going down crossing the 30-period MA. Volatility levels lowered significantly and the pair’s path remained sideways around the mean until the end of the trading day.
 ___________________________________________________________________
CRYPTO MARKETS MONITOR
BTCUSD (Bitcoin) 4-Day Chart Summary
Server Time / Timezone EEST (UTC+02:00)
Price Movement
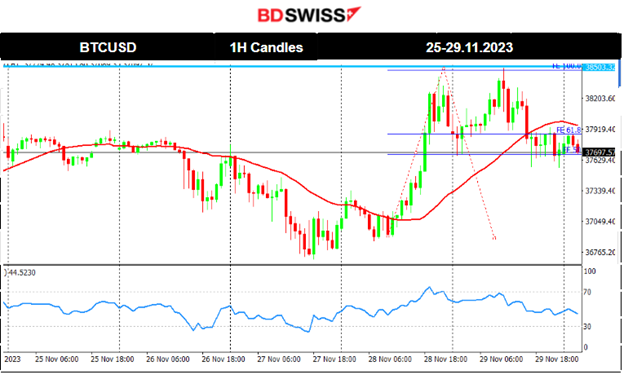
Bitcoin reversed from the downside on the 28th of the month moving upwards and crossing the 30-period MA on its way up. That was a rapid upward movement causing it to reach the resistance at 38500 before retracing. It tested that resistance one more time this week but it did not break. It currently trades near the mean 37800.
Crypto sorted by Highest Market Cap:
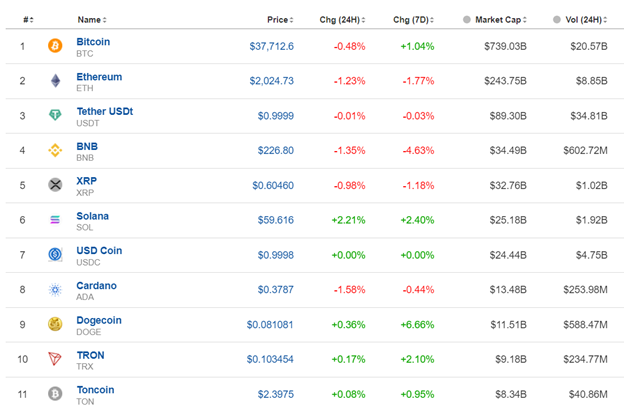
Mixed 24-hour performances for the Crypto pairs. Volatility is high but the market is reversing quickly after several attempts to move higher.
Source: https://www.investing.com/crypto/currencies
______________________________________________________________________
EQUITY MARKETS MONITOR
NAS100 (NDX) 4Hour Timeframe Chart Summary
Server Time / Timezone EEST (UTC+02:00)
Price Movement
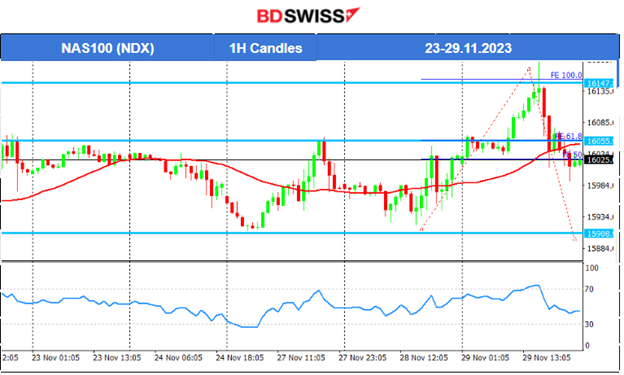
This week the NAS100 was moving mainly sideways with high volatility. It actually slowed from a long uptrend that started on the 1st Nov. This sideways movement was signalling the end of the uptrend and perhaps the start of a reversal after consolidation ends. However, we see that there is a strong resilience to the downside with the U.S. indices currently preferring to test higher levels. There are currently no good indications on the market’s direction but the support and resistance levels are at least apparent, as depicted on the chart.
 ______________________________________________________________________
COMMODITIES MARKETS MONITOR
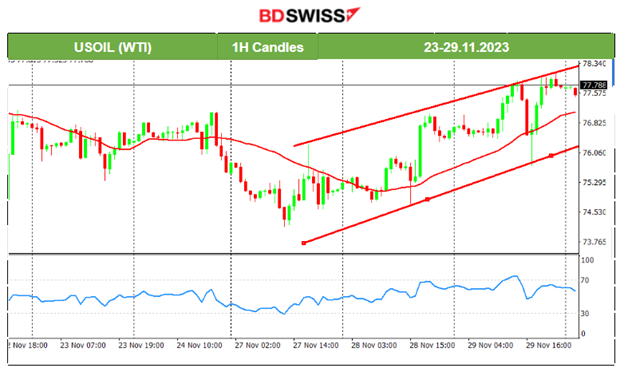
USOIL (WTI) 4-Day Chart Summary
Server Time / Timezone EEST (UTC+02:00)
Price Movement
Crude fell below the 30-period MA on the 24th and found support near 74 USD/b before reversing significantly. An upward movement started that resulted in an uptrend. We see an apparent channel showing that volatility is high and with no apparent indication that the uptrend has ended. The price reached near 78 USD/b this week and it keeps testing that level. A breakout could lead to a surge in price.
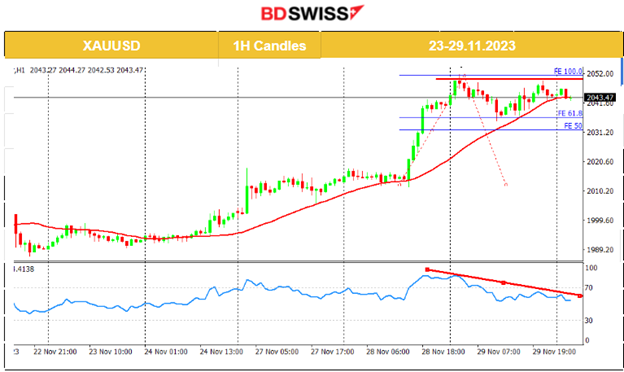
XAUUSD (Gold) 4-Day Chart Summary
Server Time / Timezone EEST (UTC+02:00)
Price Movement
Gold is currently on an uptrend. It started on the 24th Nov, moving upwards steadily and over the 30-period MA. On the 28th it jumped to higher levels before eventually retracing, but still remaining over the MA. The RSI shows signals of bearish divergence since it has lower highs. Gold currently moves to the downside probably indicating the end of the uptrend. However, we need more evidence like downward breakouts of current important support levels, such as 2035 USD/oz to suggest a reversal to the downside.
 ______________________________________________________________
News Reports Monitor – Today Trading Day (30 Nov 2023)
Server Time / Timezone EEST (UTC+02:00)
- Midnight – Night Session (Asian)
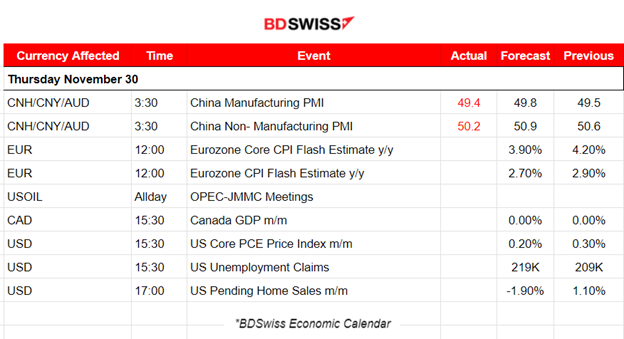
China’s Manufacturing PMI and Non-Manufacturing PMI were both reported lower than expected. No major shock was recorded in the market.
- Morning–Day Session (European and N. American Session)
The CPI flash estimates for the Eurozone are expected to be reported lower coinciding with the recent data showing that inflation is lowering significantly as the after-effect of the elevated borrowing costs. We expected that the impact of the figure release would be minimal. Some EUR depreciation might be recorded but no shocks are expected.
At 15:30 the USD might be affected by the PCE Price Index figure and Unemployment claims. Of course, the PCE figure is also expected to be reported lower than the previous month, since in the U.S. inflation rate is cooling and reported low to 3.2% according to November’s announcement.
General Verdict:
______________________________________________________________


