Previous Trading Day’s Events (17.04.2024)
BoE Governor Andrew Bailey, who said British inflation was “moving in the right direction” for a rate cut last month, also said on Tuesday that different inflation dynamics in the U.S. and Europe could lead to other paths for interest rates.
“The chances of interest rates being cut for the first time in June are now a bit slimmer,” she said.
The BoE is still expected to cut interest rates later this year but investors on Wednesday trimmed their bets on the scale of its moves, possibly as late as November. Services inflation, an indicator of domestic price pressures which the BoE also watches closely, eased only slightly to 6.0% from 6.1%.
International oil prices climbed last month amid growing tensions in the Middle East.
The BoE is concerned that rapid wage growth, which makes up much of the inflation rate in the services sector, could sustain inflationary heat across the economy.
“Inflation is in retreat but the Bank of England cannot yet be sure that it is beaten,” said Ian Stewart, chief economist at Deloitte.
Source: https://www.reuters.com/world/uk/uk-inflation-rate-slows-32-march-2024-04-17/
______________________________________________________________________
Winners vs Losers
Silver returned to the top of the week’s list of gainers having a 1.77% performance so far. It is followed by EURJPY having 1.09% as the JPY weakens further.
 ______________________________________________________________________
News Reports Monitor – Previous Trading Day (17.04.2024)
Server Time / Timezone EEST (UTC+03:00)
- Midnight – Night Session (Asian)
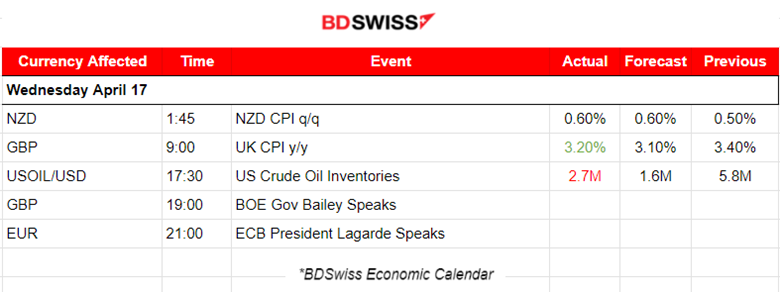
During the report at 1:45, the March inflation for New Zealand was reported to be higher than what RBNZ expected. New Zealand’s annual inflation rate dropped to 4% in March, from 4.7% in December. The Consumers Price Index (CPI) increased just 0.6% in the March quarter, up from 0.5% in the previous period. An intraday shock occurred at the time of the release. The NZD depreciated at first. The NZDUSD dropped near 30 pips before immediately reversing and continuing with a steady movement to the upside.
- Morning – Day Session (European and N. American Session)
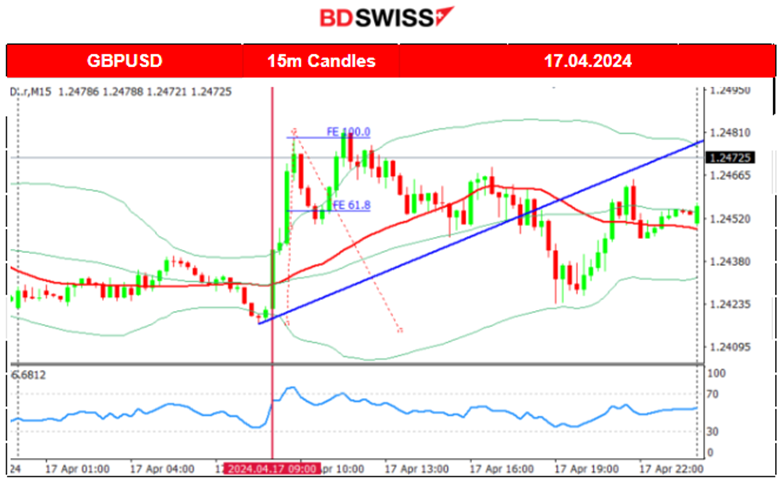
At 9:00 the Consumer Prices Index in the U.K. was reported to have risen by 3.2% in the 12 months to March 2024, down from 3.4% in February. At the time of the release, the GBP appreciated heavily causing the GBPUSD to jump near 60 pips.
General Verdict:
 __________________________________________________________________
FOREX MARKETS MONITOR
EURUSD (17.04.2024) 15m Chart Summary
Server Time / Timezone EEST (UTC+03:00)
Price Movement
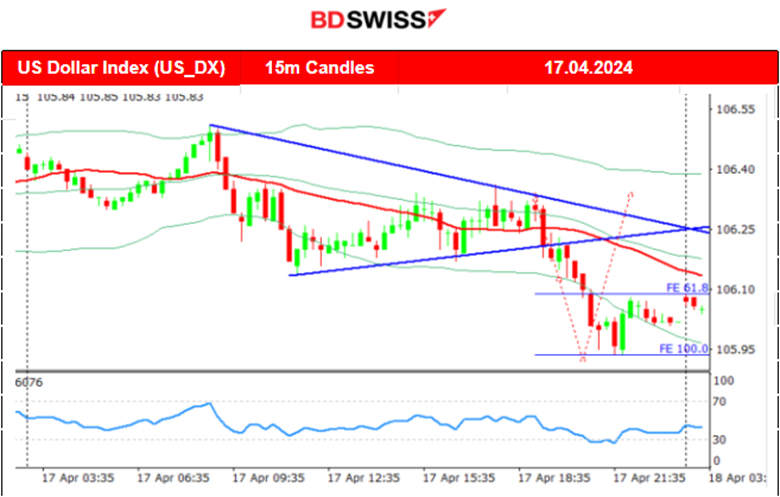
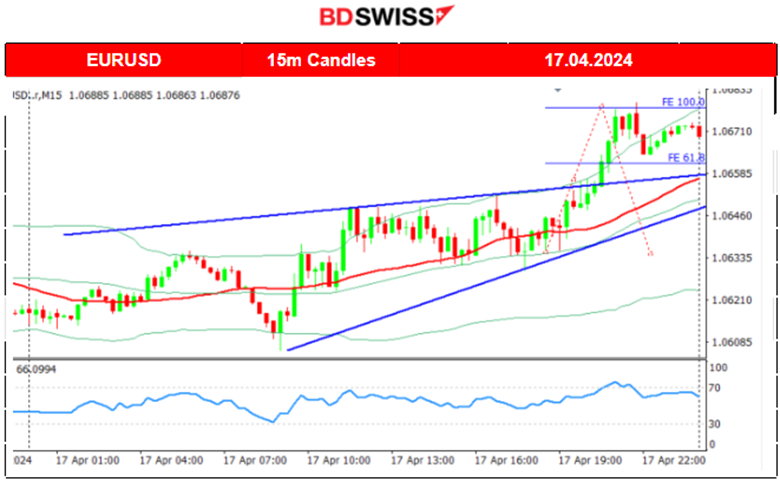
EURUSD was experiencing moderate volatility early during the Asian session and later after the start of the European session. It settled higher above the 30-period MA as the USD experienced weakening. During the N. American session it broke the intraday highs and jumped higher a result of further USD weakening.
 GBPUSD (17.04.2024) 15m Chart Summary
Server Time / Timezone EEST (UTC+03:00)
Price Movement
The pair was experiencing low volatility but that changed with the release of the inflation report for the U.K. The report showed a higher-than-expected figure and that caused GBP appreciation. GBPUSD jumped near 60 pips until it found resistance near 1.24800. It retraced soon to the 30-period MA and settled near 1.24520 before the start of the N.American session. After 16:00 the pair eventually dropped further but reversed soon as the USD started to experience strong weakening until the end of the trading day.
 ___________________________________________________________________
CRYPTO MARKETS MONITOR
BTCUSD (Bitcoin) Chart Summary 1H
Server Time / Timezone EEST (UTC+02:00)
Price Movement
Bitcoin saw a drop from 71K USD in the last few days and was moving below the 30-period MA. On Saturday, April 13th, Iran launched a drone attack on Israel and Bitcoin’s price dropped sharply reaching just below the 62K USD support. Volatility remained high and after Bitcoin’s price reversed to the upside passing the 30-period MA on its way up it signalled the end of the downside movement and the start of a sideways but volatile path. It managed to break the 62K USD support on the 17th of April, reaching the support at near 60K USD and the price remains still below the MA.
 Crypto sorted by Highest Market Cap:
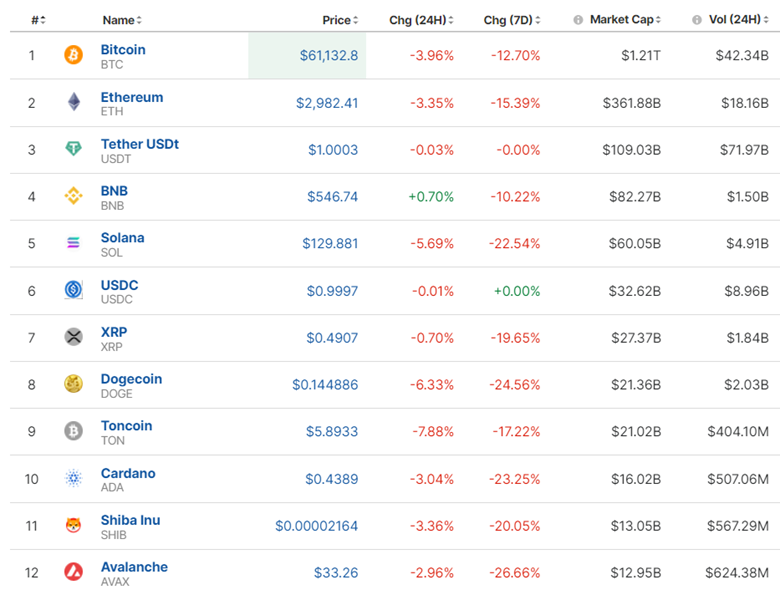
The market has not improved. Downward trend for now. The next halving is projected to take place tomorrow April 19th 2024. Historically, halving events have been associated with increases in Bitcoin’s price. This might be the turning point this market needs.
Source: https://www.investing.com/crypto/currencies
______________________________________________________________________
EQUITY MARKETS MONITOR
S&P500 (SPX500) 4-Day Chart Summary
Server Time / Timezone EEST (UTC+03:00)
Price Movement
On the 12th of April, volatility continued being high and the index suffered a huge drop breaking the support at 5,135 USD, reaching the next level at 5,100 USD before eventually retracing to the 30-period MA. On the 15th of April, it was the situation when stocks plunged after the exchange opened and the index moved lower. After a period of consolidation, on the 17th of April, it broke the support at 5,040 USD and moved lower to the next support at 5,000 USD before retracing. The breakout of the 5,000 USD level could cause a sharp drop of 65 dollars.
 ______________________________________________________________________
COMMODITIES MARKETS MONITOR
USOIL (WTI) 4-Day Chart Summary
Server Time / Timezone EEST (UTC+02:00)
Price Movement
Following Iran’s weekend attack on Israel, the price actually dropped, flirting with the 84.3 USD/b. Its breakout occurred on the 15th of April, and as mentioned in our previous analysis, the breakout caused a significant drop reaching the support of around 83.5 USD/b. The price recovered eventually with a full reversal, crossing the 30-period MA on the way up reaching 85.5 USD/b. It retraced from that level and currently remains close to the MA. Since the 16th of April, the market has shown that volatility lowers and this was the cause of a triangle formation to appear. A breakout occurred on the 17th of April eventually causing the drop of the price to 82 USD/b and the momentum seems to continue with a potential next support target at 80.5 USD/b.
 XAUUSD (Gold) 4-Day Chart Summary
Server Time / Timezone EEST (UTC+03:00)
Price Movement
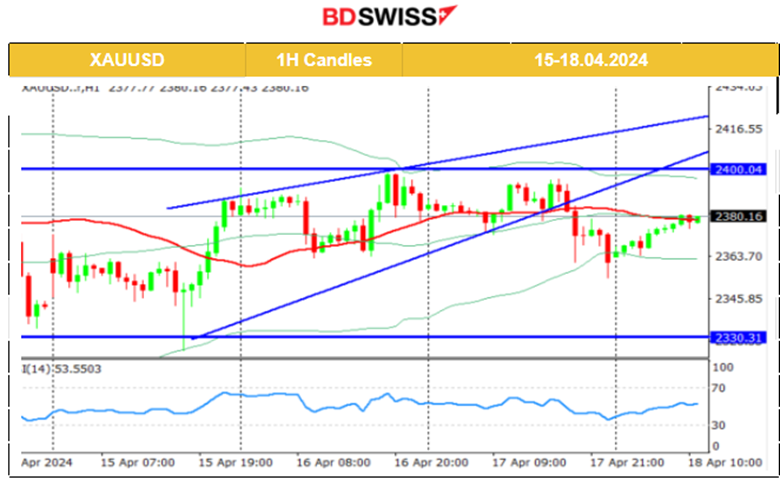
On the 15th of April, the market opened with a gap to the upside. Despite the dollar strengthening due to better-than-expected retail sales data, Gold kept its resilience and picked up momentum, moving to the upside again. The 2,400 USD remains a strong resistance level. On the 17th of April Gold moved lower as it broke the apparent upward wedge formation reaching the intraday support at 2,355 USD/oz before returning to the 30-period MA. Currently, it is settled at 2,380 USD/oz. With no obvious signals of where it might be heading. The market dynamics though keep it higher and testing of the 2,400 USD/oz level could be possible soon.
 ______________________________________________________________
News Reports Monitor – Today Trading Day (18 April 2024)
Server Time / Timezone EEST (UTC+03:00)
- Midnight – Night Session (Asian)
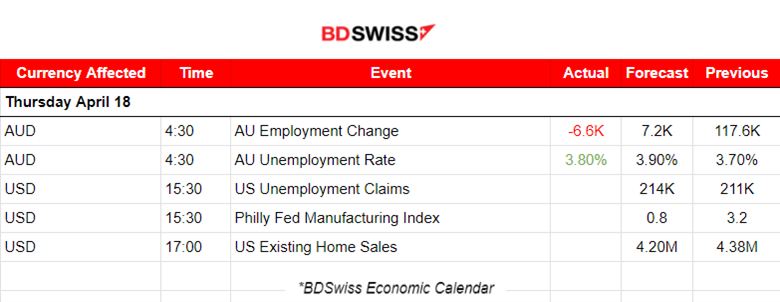
According to the employment data for Australia, employment dropped more than expected and the unemployment rate jumped to 3.8% from 3.7%. The market reacted with AUD depreciation but the impact was moderate. The AUDUSD dropped just 10 pips.
- Morning – Day Session (European and N. American Session)
At 15:30 the Unemployment Claims for the U.S. will be released and we expect not much impact on the USD pairs. Volatility levels might see a slight boost though. Currently, the figure remains close to 210K and even though it is expected to increase a bit, no major surprises to the upside are anticipated considering the strong labour market conditions that the economy is experiencing at the moment.
General Verdict:
______________________________________________________________


