
 Weekly Ranges: Testing Resistance, Establishing Trends, and the Battle at $2061")
Gold, represented as XAUUSD, has exhibited a consistent ranging behaviour within the weekly timeframe, fluctuating between the levels of $2061 and $1615 since August 2020. Notably, $2061 has proven to be a robust resistance, undergoing testing on three distinct occasions since its establishment in August 2020.
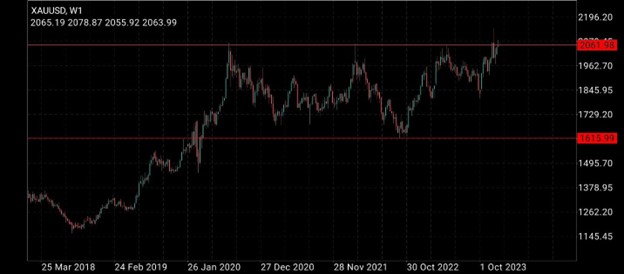
The initial encounter with this resistance occurred on March 6th, 2022. Following this test, the price faced rejection, witnessing a 7-month decline to $1615 by September 25th, 2022. Subsequently, the price rebounded, revisiting the resistance, another 7-months later at $2061 on April 30th, 2023, aiming to breach it once again. In this attempt, the price experienced a pullback to $1809 before rallying to an all-time high of $2144 on December 4th, 2023.
However, the same day saw a significant reversal, confirming the robustness of the $2061 resistance. The significance lies in the confirmation that breaking this resistance in the weekly timeframe would strongly indicate a likelihood of an uptrend continuation.
Zooming in on the 4-hour timeframe on December 4th, 2023, following the rejection at the all-time high of $2144, the price retraced to $2087 and further descended to $1973. Although there was an upward reversal, it faced rejection once again at $2087, establishing a fresh resistance within the 4-hour timeframe.
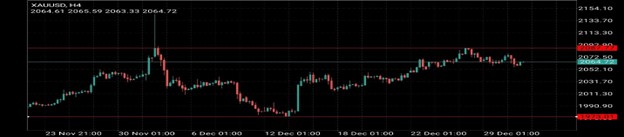
Presently, the price is caught in a range, fluctuating between $2087 and $1973. The rejection at the resistance suggests a probable descent to $1973, followed by a potential rebound back to the resistance. Conversely, if the resistance is breached, there is a heightened likelihood of the price continuing its upward trend.
The analysis prompts contemplation on the current direction of the price. As we navigate the intricacies of support, resistance, and recent price behaviour, the market’s next move remains uncertain. Observing whether the price adheres to the established range or if a breakthrough occurs at the resistance will provide valuable insights into potential trends.
In conclusion, the nuanced dynamics between key levels, such as the robust $2061 resistance, indicate a delicate balance in the market. Traders and analysts alike must remain vigilant, considering the possibilities of a range-bound movement, a descent to $1973, or a breakthrough signaling a continuation of the upward trend. The outcome will hinge on the evolving interplay of support and resistance in the coming periods.


