

PREVIOUS TRADING DAY EVENTS – 30 March 2023
Announcements:
The report overall presents a U.S. labour market that’s shown strength even with interest rate hikes being applied all year by the Federal Reserve (FED). It is still uncertain how the next moves of the FED will be and how the U.S. economy was affected by the crisis since stocks are raining and PMIs are showing growth.
Source: https://www.dol.gov/sites/dolgov/files/OPA/newsreleases/ui-claims/20230611.pdf
He noted also that so far the rising interest rates by the FED had a desirable impact: the housing market has slowed, goods prices have fallen and new leases are less expensive. The FED, he mentioned, is monitoring the economy closely to identify if the banking panic and stress that the economy has experienced so far has caused more damage than what is presented so far. Fears of a Credit Crunch are obvious.
Source: https://www.reuters.com/markets/us/feds-kashkari-banking-stress-could-last-longer-than-many-expect-2023-03-30/
The increase in real GDP primarily reflected increases in private inventory investment, consumer spending, nonresidential fixed investment, federal government spending and state and local government spending.
Within services, the increase was led by health care, housing and utilities.
Source: https://www.bea.gov/news/current-releases
______________________________________________________________________
Summary Daily Moves – Winners vs Losers (30 March 2023)

______________________________________________________________________
News Reports Monitor – Previous Trading Day (30 March 2023)
Server Time / Timezone EEST (UTC+03:00)
- Midnight – Night Session (Asian)
No significant figure releases. No intraday shocks were expected during that session.
- Morning – Day Session (European)
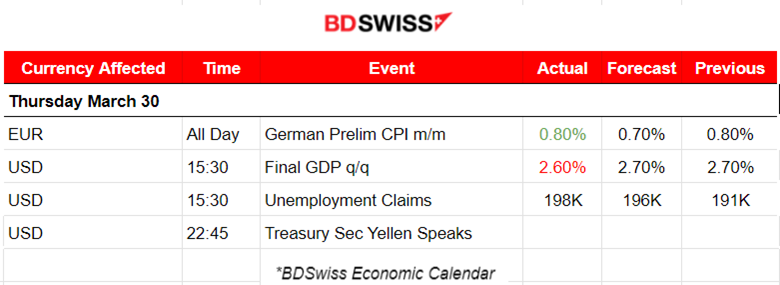
The German Preliminary CPI figure was released which was slightly higher than expected, 0.8% against 0.7%, and the EUR experienced a boost. German inflation is expected to ease significantly in March.
According to the release of the GDP figure at 15:30, the U.S. economy maintained its level of economic activity, despite rising interest rates, growing at a 2.6% annual pace. Unemployment claims remain near the same level, this time 198K, not too different from the previous figure but slightly higher. The USD has been depreciating since 7:00, as per the U.S. Dollar index which followed a downward path until the end of the day.
General Verdict:
______________________________________________________________________
FOREX MARKETS MONITOR
EURUSD 4-Day Chart Summary
Server Time / Timezone EEST (UTC+03:00)
Price Movement
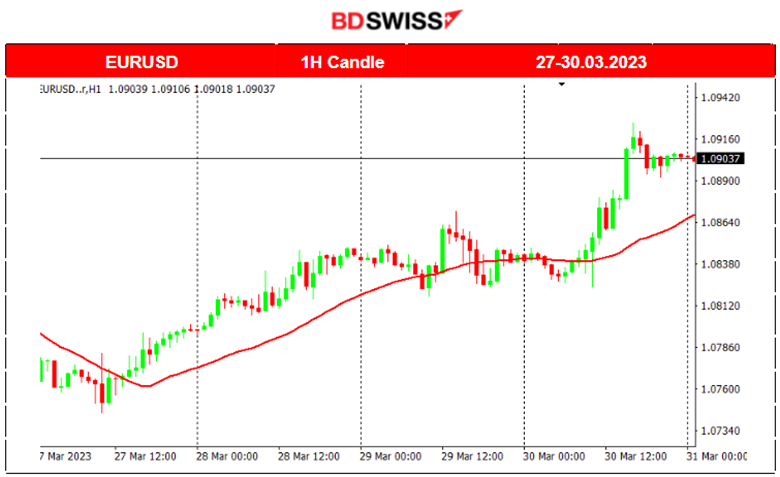
EURUSD has been gaining this week. Starting from the 27th of March, it has been moving above the 30-period MA and on the 30th, it experienced a shock moving exponentially intraday caused by the scheduled announcements of German Prelim CPI, the U.S. GDP figure.
EURUSD (30.03.2023) Chart Summary
Server Time / Timezone EEST (UTC+03:00)
Price Movement
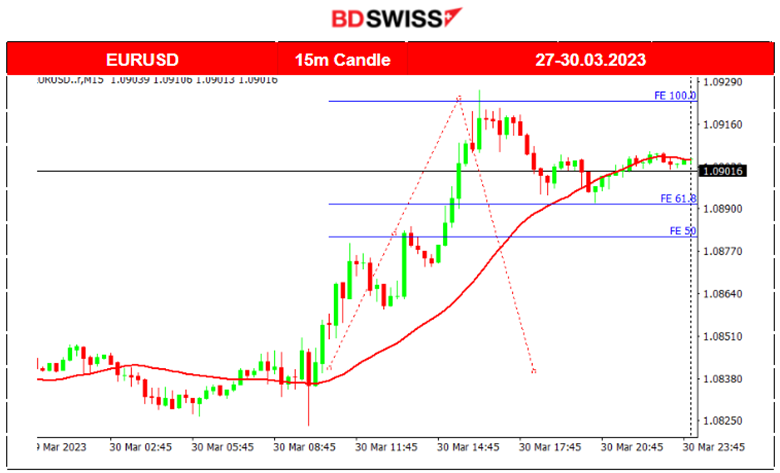
Intraday shock after the European Market’s opening caused an increase in EURUSD, the scheduled figures affecting both the EUR. The USD pushed the pair to move even higher.
Trading Opportunities
The increase in EURUSD due to EUR appreciation and USD depreciation caused a large increase in intraday pricing. The Fibonacci retracement levels help to identify the 61.8% which is the level at which the price will retrace at least. The problem is that the resistance was not easy to find (the end of the move).
Our analysis is on TradingView:
https://www.tradingview.com/chart/EURAUD/Y9xExyis-EURAUD-Reversal-and-Back-30-03-2023/
______________________________________________________________________
USDJPY 4-Day Chart Summary
Server Time / Timezone EEST (UTC+03:00)
Price Movement
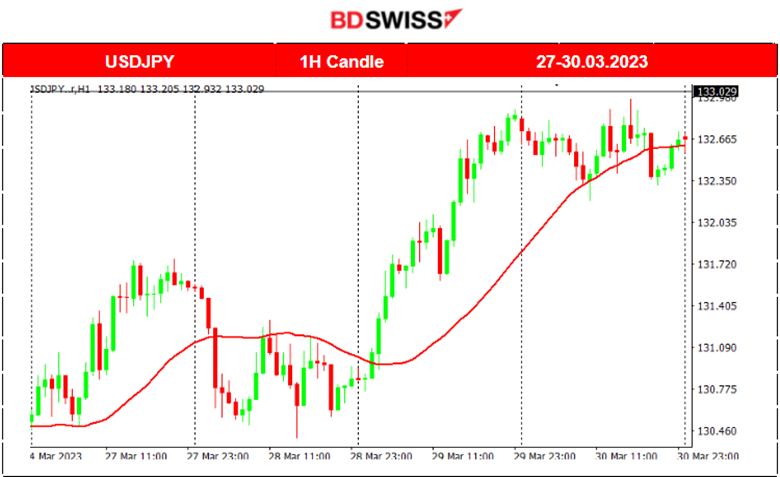
The start of the week found USDJPY moving sideways but with volatile moves around the 30-period MA. On the 29th of March, it experienced a huge increase in price, namely over 190 pips. The JPY plunged against the USD as the Bank of Japan continued to ease monetary policy aggressively, diverging further from the Federal Reserve’s increasingly hawkish stance. Later in the week, the pair showed a stabilising price.
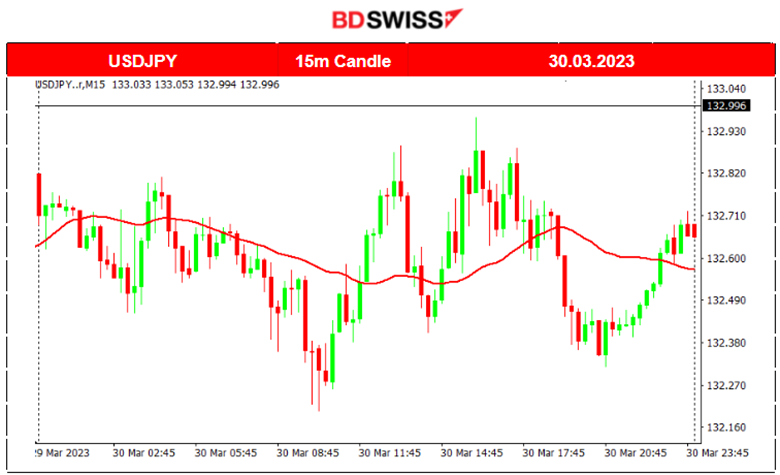
USDJPY (30.03.2023) Chart Summary
Server Time / Timezone EEST (UTC+03:00)
Price Movement
USDJPY had been moving sideways yesterday, even though the USD was depreciating greatly. JPY also suffers depreciation as major currencies are gaining ground. The pair moves around the 30-period MA with max deviations 35-40 pips from the mean.
______________________________________________________________________
EQUITY MARKETS MONITOR
NAS100 (NASDAQ – NDX) 4-Day Chart Summary
Server Time / Timezone EEST (UTC+03:00)
Price Movement
Due to the banking crisis and recent events, the stock market was experiencing large reversals but overall moving sideways without clear trends. The risk-off mood has led the NAS100 to move downwards until the 28th of March when the price reversed significantly, crossing the 30-period MA and moving steadily upwards until yesterday. Rising prices of metals and stocks show that investors’ appetite is mixed towards risk.

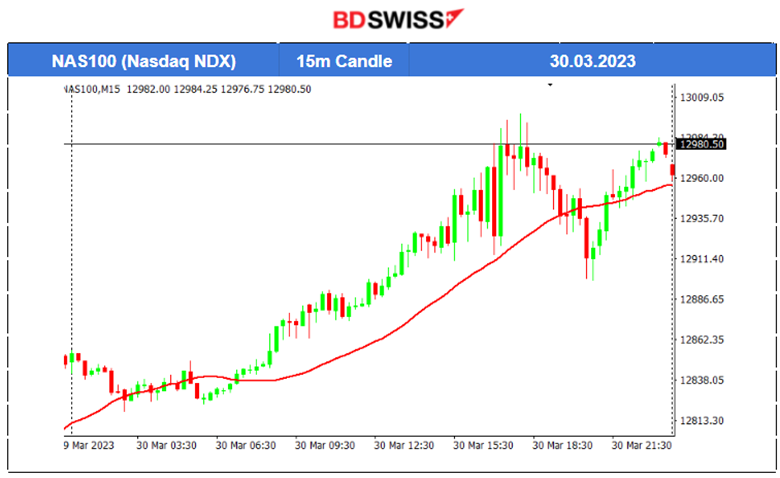
NAS100 (NASDAQ – NDX) (30.03.2023) Chart Summary
Server Time / Timezone EEST (UTC+03:00)
Price Movement
After the Market opening at 16:30, NYSE, the index experienced volatility with short ups and downs showing extreme uncertainty. The USD has been depreciating and investors’ risk-on mood has been turned off as they move to metals. However, the price of stocks remains stable and moves around the upward 30-period MA.
______________________________________________________________________
COMMODITIES MARKETS MONITOR
GOLD (XAUUSD) 4-Day Chart Summary
Server Time / Timezone EEST (UTC+03:00)
Price Movement
Gold has been experiencing volatility after experiencing a drop this week from the level of 2000 USD that its price had experienced on the 24th of March. The price has been moving around the 30-period MA with max deviations around the mean of 15-20 USD. Due to the recent risk-off mode of investors as shown yesterday, Gold has been rising again experiencing a high increase yesterday, 30th of March.
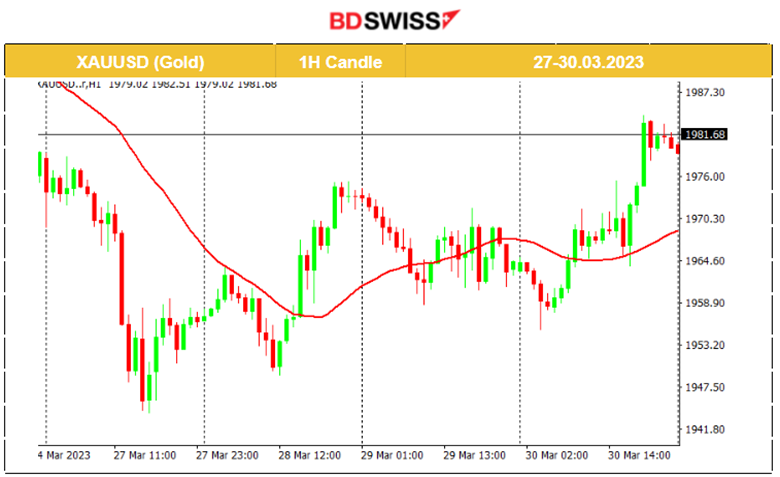
GOLD (XAUUSD) (30.03.2023) Chart Summary
Server Time / Timezone EEST (UTC+03:00)
Price Movement
As USD depreciated in value yesterday, Gold gained in value. It seems that investors’ risk appetite is dissipating and investors are reaching for safe havens, such as precious metals. It steadily moved upwards the whole day and above the 30-period MA, ending the day at CFD Price of 1979 USD.

USOIL (WTI) 4-Day Chart Summary
Server Time / Timezone EEST (UTC+03:00)
Price Movement
Crude’s price has been rising this week from the 27th to the 29th of March, moving over the 30-period MA. On the 29th, the figure for the change in the number of barrels of Crude Oil held in inventory by commercial firms during the past week was reported to be -7.5M. That created an intraday shock downwards with the price reversing and moving below the 30-period MA. The next day, 30th of March, Crude’s price reversed and moved again steadily upwards showing its upside resilience.

USOIL (WTI) (30.03.2023) Chart Summary
Server Time / Timezone EEST (UTC+03:00)
Price Movement
After the Asian Trading Session, the price of Crude experienced more volatility. Its price started to move upwards steadily over the 30-period MA reaching its highest for the day CFD price, at 74.6 USD.
Trading Opportunities
News reports say that oil price is headed further upwards since Iraq’s oil exports from Turkey are unlikely to resume this week, as a dispute between Baghdad and Kurdistan has halted around 400,000 barrels a day continues.

______________________________________________________________
News Reports Monitor – Today Trading Day (31 March 2023)
Server Time / Timezone EEST (UTC+03:00)
- Midnight – Night Session (Asian)
No significant figure releases. No intraday shocks are expected during that session.
- Morning – Day Session (European)
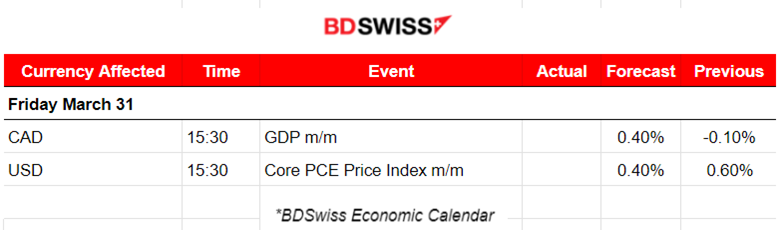
The GDP figure for Canada is going to be released at 15:30 and since this is a basic and important economic indicator, it is possible for the CAD pairs to experience large shocks intraday followed by retracements. Volatility on Fridays is generally low.
The Core PCE Price index for the U.S. is going to be released at the same time. It is the change in the price of goods and services purchased by consumers, excluding food and energy. USDCAD might deviate significantly from the 30-period MA, depending on the figures. Caution must be taken due to the fact that the pair might not retrace if the figures are pushing in one direction without resistance/support.
General Verdict:
______________________________________________________________


