Previous Trading Day’s Events (17 Jan 2024)
Expectations for when rate cuts could be implemented changed immediately. A roughly 60% chance that the Bank of England (BoE) would start to cut rates by mid-May, down from just over 80% late on Tuesday.
Inflation began to fall faster than expected in the latter months of last year, a surprisingly large drop giving the impression that it would be back at the BoE’s 2% target by April or May this year. However, these data change everything.
The rise in Britain’s inflation rate in December followed increases seen in the Eurozone and the United States and – unlike earlier in 2023.
Michael Saunders, a former BoE policymaker: “The bigger picture is that inflation is falling more sharply overall than the Bank of England had expected a few months ago,” he said. “Their thoughts will be starting to turn towards interest rates possibly coming down later this year … perhaps starting around the middle of the year.”
Core inflation – which excludes volatile food, energy, alcohol and tobacco prices – was unchanged 5.1% in December. Services inflation increased to 6.4% in December from 6.3% in November.
Source:
https://www.reuters.com/world/uk/uk-inflation-rate-rises-4-december-2024-01-17
Economists changed their economic growth estimates for the fourth quarter, casting further doubt on financial market expectations that the Federal Reserve would start cutting interest rates in March after taking into account the NFP/strong employment report and the recently released inflation report.
Fed Governor Christopher Waller on Tuesday described the economy as “doing well,” which he said was giving the U.S. central bank “the flexibility to move carefully and methodically” on monetary policy.
“The economy is still flying high enough and economists can take down those recession forecasts this year,” said Christopher Rupkey, chief economist at FWDBONDS in New York. “For Fed officials, the economy is not too hot and not too cold, but it is just right perhaps for a few interest rate cuts in 2024.”
“We recommend averaging the December and January retail sales data, or averaging over the November to February period, to get a more reliable read on the state of the consumer,” said Aditya Bhave, senior U.S. economist at Bank of America Securities in New York.
“There is the possibility we’ll see some level of pullback in consumer spending in 2024 as consumers reevaluate their budgets and pay down some elevated debt levels,” said Mike Graziano, a senior consumer products analyst at RSM US. “However, even if that is the case, consumers are on solid footing entering 2024.”
With the Fed expected to start cutting rates this year, most economists are confident the economy will avoid a downturn.
Source: https://www.reuters.com/markets/us/us-retail-sales-beat-expectations-december-2024-01-17/
______________________________________________________________________
Winners vs Losers
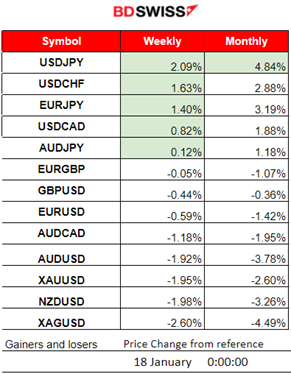
The USDJPY still remains on the top of the week’s top performers with 2.09% gains and is leading this month with 4.84% gains so far.
 ______________________________________________________________________
News Reports Monitor – Previous Trading Day (17 Jan 2024)
Server Time / Timezone EEST (UTC+02:00)
- Midnight – Night Session (Asian)
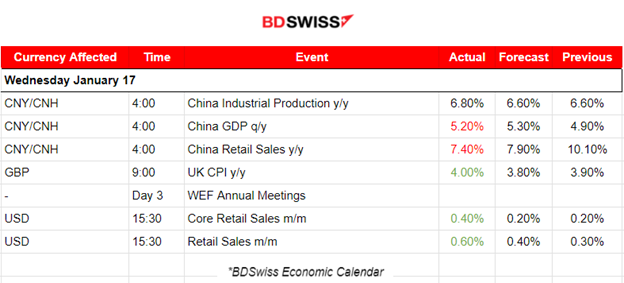
The reports early on the 17th Jan during the Asian Session indicated that the yearly figure for calculating industrial production increased in China while the quarterly GDP figure showed a 5.20% growth versus the expected 5.3% but higher than the previous figure. The Retail sales figure was reported lower, however, 7.4% against the expected 7.9%. The Australian Dollar lost a lot of ground after the mixed Chinese data.
- Morning–Day Session (European and N. American Session)
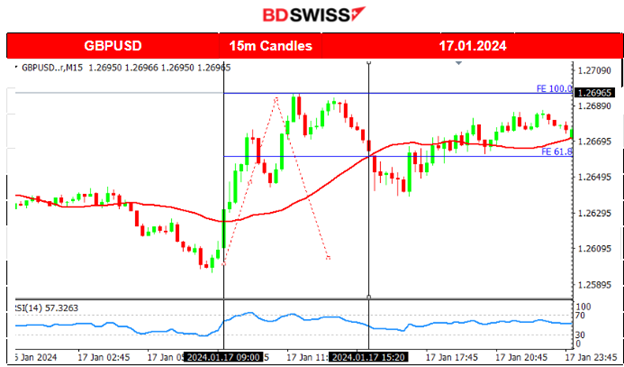
UK’s inflation was reported surprisingly higher at 9:00 to 4%, up from 3.9% in November, and the first time the rate has increased since February 2023. The market reacted with strong appreciation against other currencies. The GBPUSD jumped at the time of the release by nearly 30 pips and continued to move upwards reaching more than 60 pips movement to the upside so far.
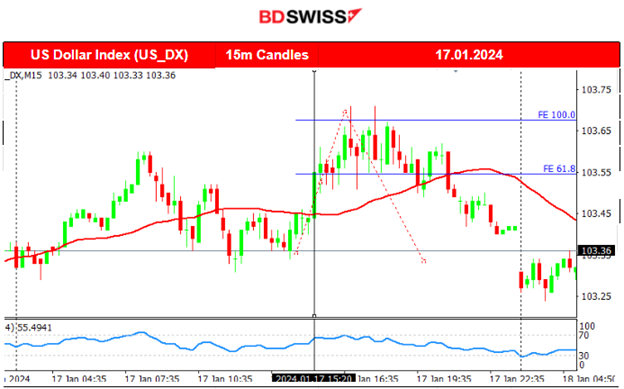
Retail Sales figures for the U.S. were reported surprisingly higher than expected. They rose 0.6% month-on-month in December, above the 0.4% consensus. This U.S. economy’s resilience further supports the view that the Fed will wait until the second quarter before cutting rates. The market reacted with USD appreciation at the time of the release, with moderate intraday shock.
General Verdict:
 ____________________________________________________________________
FOREX MARKETS MONITOR
EURUSD (17.01.2024) 15m Chart Summary
Server Time / Timezone EEST (UTC+02:00)
Price Movement
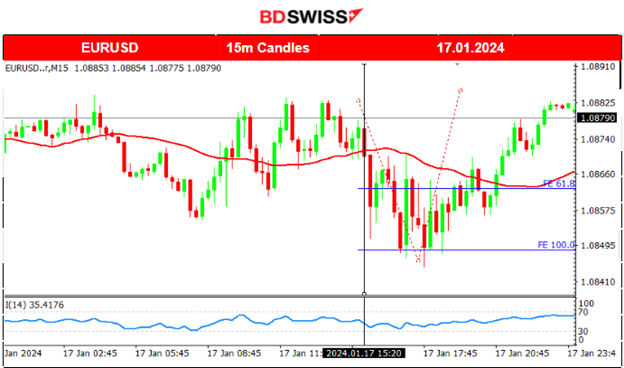
The pair experienced moderate volatility levels during the trading day and a sideways path. Deviations from the mean were reaching near 15 pips before the Retail Sales news reports. At the time of these releases, the USD experienced appreciation against other currencies and the EUR causing the pair to drop to the resistance near 1.085 before immediately reversing to the mean. More activity was observed after the release but it kept the pair sideways until the start of the N.american session when it finally moved to the upside, crossing the 30-period MA on its way up and eventually closing the trading day almost flat.
GBPUSD (17.01.2024) 15m Chart Summary
Server Time / Timezone EEST (UTC+02:00)
Price Movement
The pair experienced high volatility after 9:00 when the UK’s inflation was reported surprisingly higher. The GBP appreciated heavily against the USD causing it to jump, crossing the 30-period MA on its way up and eventually reaching the strong resistance for the day at near 1.26965. Retracement followed with the pair returning to the MA and to the 61.8 Fibo level. The pair continued with very low volatility and a sideways movement, closing eventually higher for the trading day.
 ___________________________________________________________________
CRYPTO MARKETS MONITOR
BTCUSD (Bitcoin) Chart Summary 4H Timeframe
Server Time / Timezone EEST (UTC+02:00)
Price Movement
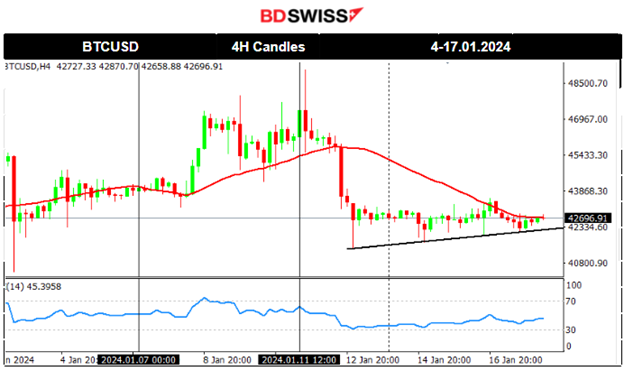
Bitcoin fell lower on the 10th Jan reaching the support at near 44300 USD before reversing, returning back to the MA just before the SEC announcement for approval. U.S. regulators eventually approved Bitcoin ETFs, dramatically broadening access to the 15-year-old cryptocurrency and its price experienced an intraday shock with high volatility. The price eventually settled near 46K USD as volatility calmed. On the 11th though, bitcoin saw an upward movement during the time the inflation report was released, for the U.S. Its price reached the resistance near 49K USD and, soon after, it experienced a sudden drop back to the 30-period MA. It remarkably dropped from the mean near 46K USD and moved a lot lower to the support near 42K USD before retracing to the MA and settling close to the 43K USD level. It has remained in consolidation around this low level since the 13th Jan. We should expect a shock soon, possibly driving the price to the upside.
Crypto sorted by Highest Market Cap:
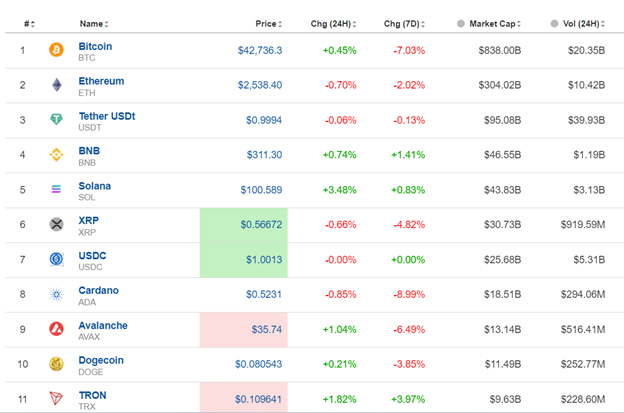
Cryptos are currently in a state of consolidation, prices remained stable at lower levels after a fall on Friday 12th Jan. There are currently no big deviations from the lows.
Source: https://www.investing.com/crypto/currencies
______________________________________________________________________
EQUITY MARKETS MONITOR
NAS100 (NDX) 4Hour Timeframe Chart Summary
Server Time / Timezone EEST (UTC+02:00)
Price Movement
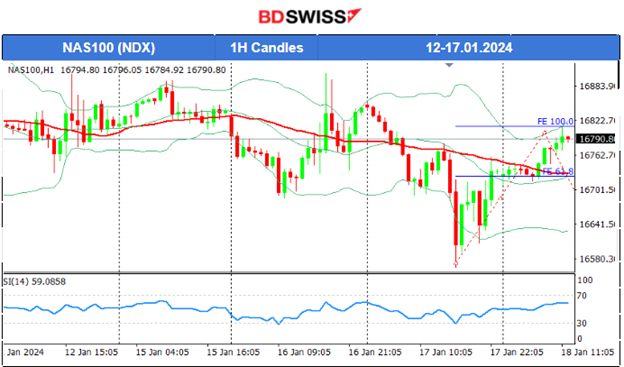
A breakout to the downside took place on the 16th Jan, breaching the triangle formation, as depicted on the chart. The index moved lower and lower rapidly with the price reaching the support at 16695 USD. The index soon reversed to the upside and tested the resistance at near 16900 USD once more without success after the NYSE opening. Retarcement to the mean followed signalling strong resistance for U.S. stocks currently. All other benchmark indices are experiencing the same resistance as they are staying at lower short-term levels following a downtrend. On the 17th Jan the index broke significant support levels bringing down to the support at near 16580 USD before eventually reversing. The reversal was full, taking the price all the way back to the mean and beyond. Currently, the 16790 level could prove a strong resistance level that could serve as the end of the reversal and the start of a retracement. That level lies also at the upper band of the Bollinger bands supporting the view of a retracement even more.
 ______________________________________________________________________
COMMODITIES MARKETS MONITOR
USOIL (WTI) 4-Day Chart Summary
Server Time / Timezone EEST (UTC+02:00)
Price Movement
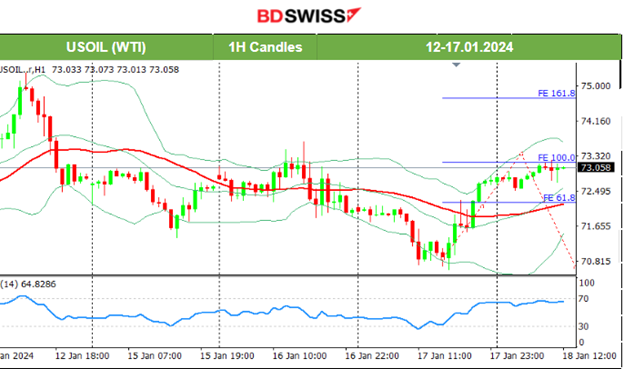
The 30-period MA is currently stable with the mean close to 72 USD/b. It is quite volatile though as deviations from the MA reach more than 1 USD. On the 17th Jan the price eventually dropped further as mentioned in our previous report reaching the support at 70.6 USD/b. After testing that support unsuccessfully it reversed heavily to the upside, crossing the MA on its way up and remarkably reaching the resistance near 73 USd/b. It is probable that this level will serve as a turning point and the beginning of a retracement back to the MA.
XAUUSD (Gold) 4-Day Chart Summary
Server Time / Timezone EEST (UTC+02:00)
Price Movement
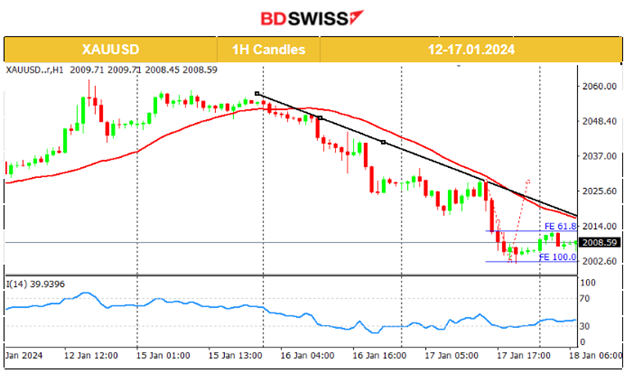
On the 15th Jan Gold remained stable on a sideways path due to low volatility close to the support near 2050 USD/oz. That level was broken however on the 16th Jan with the price dropping rapidly, reaching 2024 USD/oz as the USD appreciated heavily. Retracement to the 61.8 Fibo level did not occur on the same day as the USD strengthened steadily. The price broke the support at near 2017 USD/oz on the 17th Jan, moving to the next at 2001 USD/oz. It retraced to the 61.8 Fibo level after that.
 ______________________________________________________________
News Reports Monitor – Today Trading Day (18 Jan 2024)
Server Time / Timezone EEST (UTC+02:00)
- Midnight – Night Session (Asian)
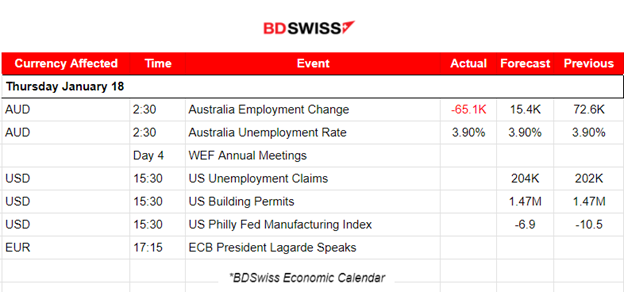
Australia’s report regarding the employment change surprised the market with a negative figure -65.1K, while the jobless rate held steady at 3.9% as fewer people went looking for work. Full-time employment sank 106.6K in December. The jobless rate stayed at 3.9%. The participation rate dropped sharply to 66.8% from 67.3%. At the time of the report release the AUD experienced a sharp depreciation. The AUDUSD dropped near 20 pips but immediately reversed to the mean as the effect faded causing strong AUD appreciation. After that, the pair continued the initial sideways path around the mean.
- Morning–Day Session (European and N. American Session)
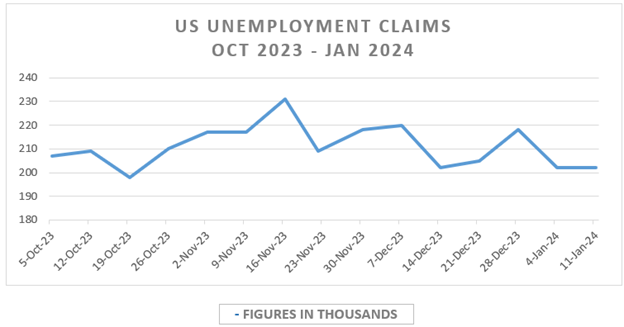
At the time of the Unemployment Claims report release, we could see higher volatility levels for the USD pairs. The figure has to deviate greatly however from the typical range of 200K-220K that we see recently. Based on the strong labour data for the previous month we can expect that the actual figure might be reported lower than expected.
General Verdict:
______________________________________________________________


