PREVIOUS TRADING DAY EVENTS – 12 May 2023
Announcements:
“With the key services side of the economy continuing to slow in the face of higher borrowing costs and rising prices, it still feels like we’re walking through treacle,” said Tom Stevenson, personal investing director at fund manager Fidelity International.
U.K.’s inflation is enormous, nearly 10% higher than the U.S. and Eurozone. The Bank of England raised its main interest rate last week to 4.5%, the highest since 2008 and forecasts that the economy will grow 0.25% in 2023.
“While recession is probably no longer on the cards, vulnerabilities resulting from higher borrowing costs and tighter credit are likely to dampen business and household activity this year,” KPMG economist Yael Selfin said.
Source: https://www.reuters.com/world/uk/uk-economy-shows-01-growth-first-quarter-2023-ons-2023-05-12/
Consumers expect rising prices at an annual rate of 3.2% over the next five to 10 years and anticipate higher costs by 4.5% over the next year.
“While current incoming macroeconomic data show no sign of recession, consumers’ worries about the economy escalated in May alongside the proliferation of negative news about the economy, including the debt crisis standoff,” as Joanne Hsu, director of the survey, said in a statement.
The aforementioned expectations result from a combination of high inflation and recession concerns.
______________________________________________________________________
Summary Daily Moves – Winners vs Losers (12 May 2023)

______________________________________________________________________
News Reports Monitor – Previous Trading Day (12 May 2023)
Server Time / Timezone EEST (UTC+03:00)

- Midnight – Night Session (Asian)
Expectations for inflation one and two years ahead decreased to 4.28% and 2.79% respectively. This release did not have much impact on NZD.
- Morning – Day Session (European)
The report at 9:00 showed a negative monthly change for the U.K.’s GDP that was estimated to have fallen by 0.3% in March 2023. There was no significant effect on the GBP pairs.
The U.S. Preliminary UoM US Consumer Sentiment figure showed a 57.7 level, much lower than the previous figure. The Long-Term Inflation Expectations hit 12-Year High reflecting growing concerns about the economic outlook. The USD appreciated significantly during the trading day.
General Verdict:

______________________________________________________________________
FOREX MARKETS MONITOR
EURUSD (12.05.2023) Chart Summary
Server Time / Timezone EEST (UTC+03:00)
Price Movement
After 9:00 during the European session, the EURUSD started to move downwards steadily until the end of the trading day. We know by looking at the DXY chart that this is due to the USD appreciation on Friday, where USD was the main driver. News regarding US sticky prices might have affected expectations regarding future rate hikes thus USD appreciation currently can be explained.

EURUSD Day Candles Chart Summary
Server Time / Timezone EEST (UTC+03:00)
Price Movement
In our recent webinars, we have been discussing the interesting chart that was formed and that is visible using the Daily timeframe. The pair has experienced strong resistance after a relatively rapid upward movement since March 2023. It was noticeable that it started to reverse after testing that resistance many times and eventually showed signals of retracement. It retraced eventually more than 61.8% of the total move.
Support Levels:

____________________________________________________________________
EQUITY MARKETS MONITOR
NAS100 (NDX) 4-Day Chart Summary
Server Time / Timezone EEST (UTC+03:00)
Price Movement
NAS100 U.S. stocks were climbing higher this week. A pause in rate hikes enhances the risk-on mood but the latest inflation-related figures have affected investor decisions. Pause in rate hikes might not take place, USD appreciated and stocks moved lower. On Friday the market fell after finding intraday resistance and this downward movement was in line with our expectation of a decline based on the technicals. Bearish divergence was formed as per the chart below: RSI with lower highs, Price with higher highs.

______________________________________________________________________
COMMODITIES MARKETS MONITOR
USOIL (WTI) 4-Day Chart Summary
Server Time / Timezone EEST (UTC+03:00)
Price Movement
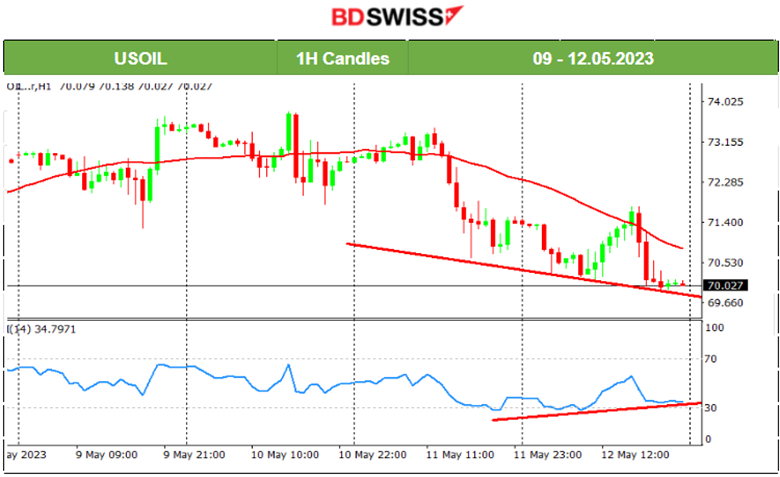
The oil price started to move downwards on the 11th of May crossing the 30-period MA and staying lower moving below it for the rest of the week as USD appreciates. Analysing recent activity with technicals only: The RSI signals bullish divergence since it formed higher lows while the price formed lower lows.

XAUUSD (Gold) 4-Day Chart Summary
Server Time / Timezone EEST (UTC+03:00)
Price Movement
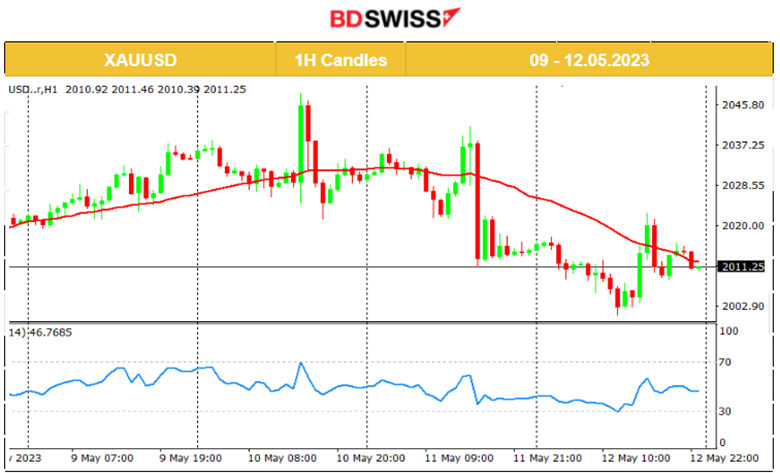
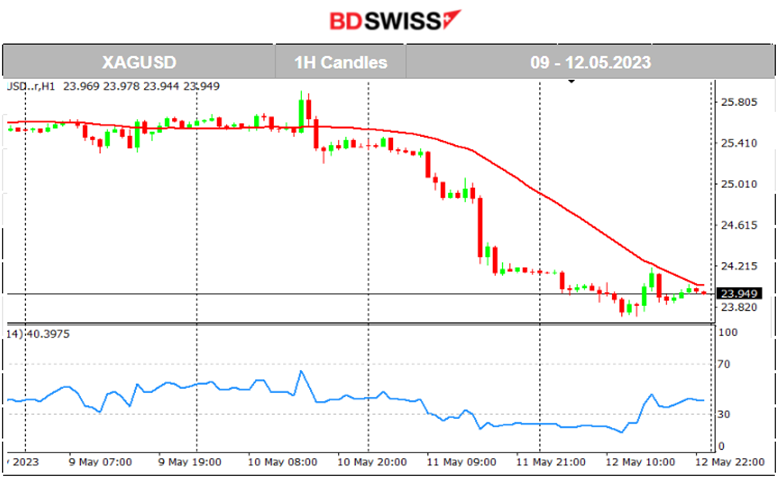
Gold, like oil, experienced a similar price path to lower levels. USD appreciation and future higher inflation expectations are creating turmoil in the market. Gold has shown resilience in dropping much while Silver did not. Silver experienced a rather high drop, with more negative price change than -4% this month.

XAGUSD (Silver) 4-Day Chart
Server Time / Timezone EEST (UTC+03:00)

______________________________________________________________
News Reports Monitor – Today Trading Day (15 May 2023)
Server Time / Timezone EEST (UTC+03:00)

- Midnight – Night Session (Asian)
No significant news announcements, no important scheduled releases.
- Morning – Day Session (European)
Several reports are taking place concerning the EUR but no significant shocks are expected to take place. The market will probably move steadily in one direction and slowly if not sideways around the mean.
At 15:30 the Empire State Manufacturing Index figure will be reported. This might cause a small intraday shock for the USD pairs. Business conditions in manufacturing are a good indicator of current business activity and affect expectations.
General Verdict:
______________________________________________________________


