Rates as of 04:00 GMT
Market Recap
The US stock market opened with euphoria yesterday on reports that the number of new virus cases in various hotspots was peaking, but two minutes after opening proved to be the high for the day (+3.5%) as euphoria gradually gave way and stocks finished down slightly (-0.16%). Stocks in Asia are mixed this morning. Nonetheless, a number of equity markets have now technically entered “bull market” territory, having risen 20% from their recent lows.
Fun facts to know and tell: Statistics on the daily high, low & close for the S&P 500 are available from April 1982. Since then, it’s only happened three times that the market was up over 4% during the day and closed lower: 3 Oct 2008, 14 Oct 2008, and 17 Oct 2008.
The anomaly is even more pronounced if we look at the Dow Jones Industrials Average, which was up 4.1% near the opening but also closed lower (-0.12%). Since 1929, there’s only been one other day that it was up more than 4% and closed down on the day: 14 Oct 2008, the day that then-US Treasury Secretary Paulson forced the banks to take TARP money. (And on 15 October 2008, the S&P 500 fell 7.9%.) (These statistics courtesy of Jim Bianco.)
In other words: the market is trading like it’s October 2008. And in October 2008, the market was still six months and another 25% from the bottom.
I could easily see the market mood changing again. Although the number of new virus cases each day seems to have peaked in places, the number of deaths each day is still rising, because of the disease’s slow progress. That tends to blunt the impact of the progress that’s being made. Also, it’s likely that even when societies reopen, various social distancing measures will have to remain in place.
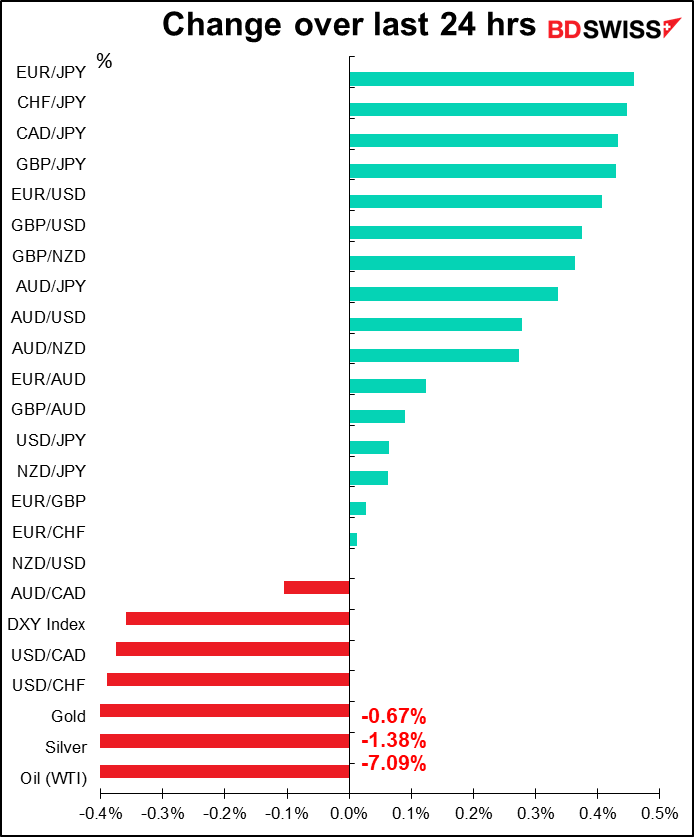
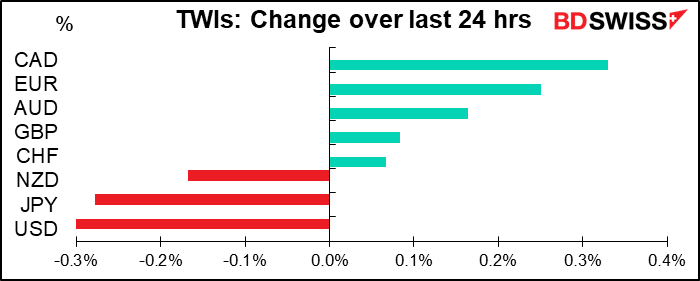
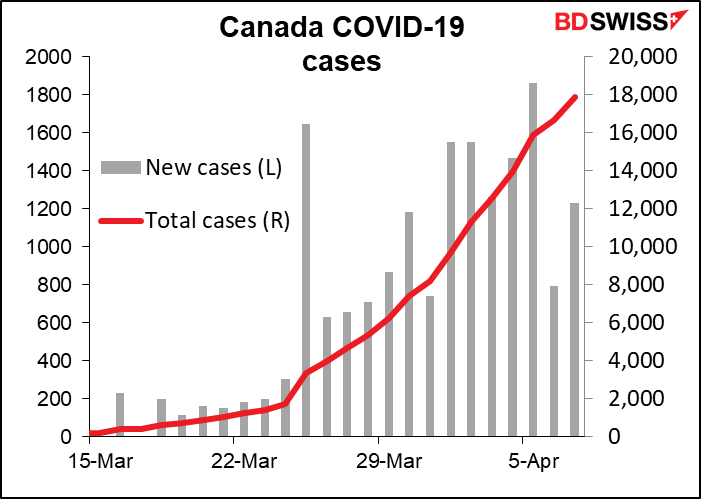
Against this background, the FX market took a generally “risk on” mood: higher commodity currencies and lower USD and JPY. I was impressed that CAD was the best-performing currency even though oil prices fell (see below) and the Ivy purchasing managers’ index (PMI) fell to a record low (data back to 2000). This is probably because of signs that the number of infections in Canada has peaked – showing that the virus is everything nowadays.
The Eurogroup meeting of Eurozone finance ministers failed to come up with an agreement last night. The press conference that was supposed to be held last night is now scheduled for 0800 GMT.
Oil fell sharply during the European day but began recovering during US trading time. The market seems undecided about what will happen at Thursday’s OPEC+ meeting.
Everyone believes that OPEC+ will agree to cut output only if the US and other producers outside the group join in curbing production.
Here’s where it gets complicated. The US Energy Information Agency yesterday issued new forecasts for oil production: they cut their 2020 output forecast by 1.23mn b/d and their 2021 forecast by 1.6mn b/d. The US Energy Department then issued a statement saying, “With regards to media reports that OPEC+ will require the United States to make cuts in order to come to an agreement: The EIA report today demonstrates that there are already projected cuts of 2 (million bpd), without any intervention from the federal government.”
The question is, what’s the implication here? Does this mean that the US won’t go along with OPEC+, as a Reuters article argued? In which case the OPEC+ agreement will probably fall through.
Or is it a signal to OPEC+ that while the US can’t take any overt action to reduce output, it is in effect cutting production by 14.1%, as Bloomberg argued. That would be quite enough to satisfy the other OPEC+ members.
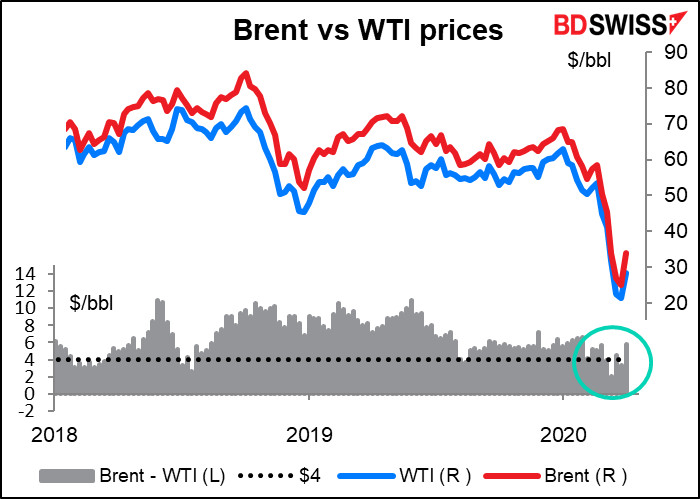
I think it’s the latter and the fall in US output will be seen as the US “contribution” to efforts to shore up prices. That’s because it’s in everyone’s interests to keep prices from falling further, not least the US. The US needs to shore up prices so that a) shale producers can continue to be profitable (they need prices of around $45/bbl) and b) the US can continue to export oil (there has to be a price differential of at least $4/bbl between WTI and Brent to make it worthwhile shipping WTI to Europe). The question is whether even this administration can spin it so that cooperating with the dreaded OPEC can be made politically palatable. That may be where Friday’s G20 energy ministers’ meeting comes in: “global policy coordination” may be the fig leaf the US hides behind to justify joining the oil cartel.
Japan’s PM Abe declared a state of emergency for Japan but stopped short of ordering businesses to close. He just urged all office workers to work from home. The declaration will make it easier for local officials to take measures such as canceling events, restricting the use of facilities, and appropriating buildings for temporary medical facilities. The government also unveiled a fiscal stimulus package equivalent to 20% of GDP, including direct spending of about 7% of GDP on cash payments to households and liquidity injections for smaller firms. I’m afraid that Japan, with its crowded cities and large number of elderly citizens, will be hard-hit by the virus, which would tend to be bad for the yen.
An aside
Yesterday I mentioned how markets were discounting the end of the virus crisis even as it enters the peak period in the US. The sensationalist Wall Street news site Zero Hedge ran the following picture of a woman at the returns counter of a store with the caption “Is This The Newest & Hottest Leading Economic Indicator?” From the picture it looks like some consumers are regaining confidence, although if so, it’s not expected to show up in tomorrow’s U of Michigan consumer sentiment survey.

Today’s market
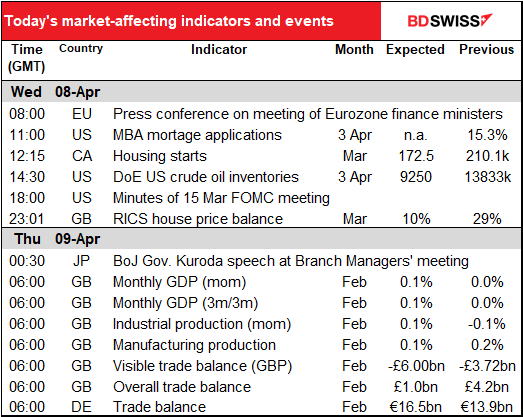
The main point of interest during the European day will be the results of the Eurogroup meeting, which as mentioned above we should know from the press conference this morning.
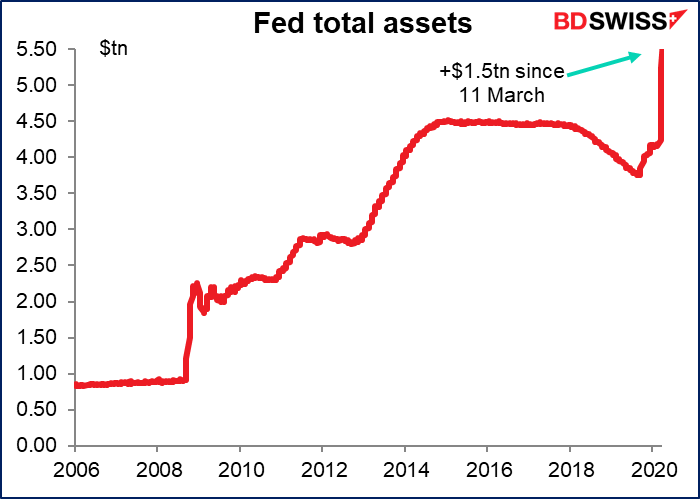
During the US day the focus will be on the minutes of the Fed’s 15 March emergency FOMC meeting. This was the unscheduled Sunday meeting where they cut rates by 100 bps and announced an increase in their bond-buying program by at least $700bn. The meeting was probably overshadowed by later events, when they announced more plans and ideas to support the economy. Over the last two weeks they’ve been buying more than $1mn of assets every second, 24 hours a day, five days a week. Nonetheless it will be worth seeing what they were thinking at the time.
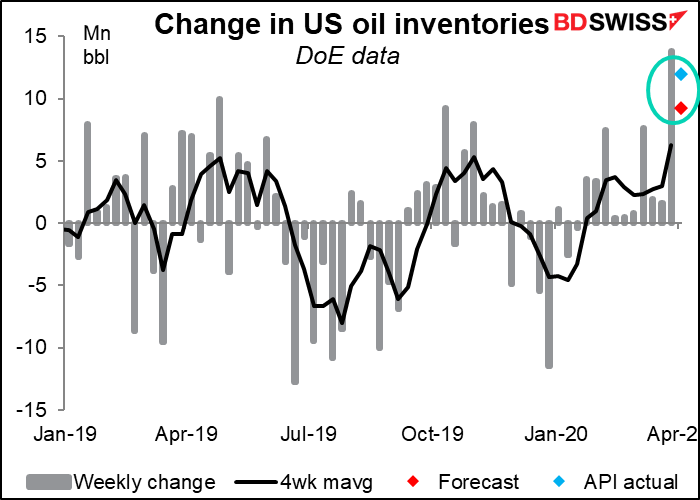
The weekly US Department of Energy crude oil inventories are another “live” indicator that the market is watching, although it’s hard to say what it means – the only question is how fast inventories are rising, not whether they are rising or falling. Either way is bad, the only question is how bad. At some point, not as bad becomes good.
Yesterday’s figure from the American Petroleum Institute (API) showed yet another enormous build of 11.9mn barrels.
Overnight Bank of Japan Gov. Kuroda will make a speech to the Branch Managers’ meeting, which will no doubt be in person and not virtual. I doubt if he’ll say anything about changing tack – they did what they could back on 16 March as part of the global semi-coordinated moves by various central banks. Now it’s time to wait and see the impact of their moves and the impact of the so-far meager actions the government has taken to deal with the virus. The government isn’t in panic mode yet so I doubt if the Bank of Japan will be either. I wish they would be though because I have a daughter in university in Japan and I’m worried about her.
After that, it’s the early-morning UK statistics. I thought maybe I was making a mistake on the times, but I checked and yes they have indeed changed the time for release, an unexpected side-effect of the virus. The Office for National Statistics (ONS) explains on its website that it used to publish all its statistics at 0930 local time. For the more market-sensitive indicators, the ONS had secure ‘lock-in’ briefings for accredited newswires, which got access to the releases prior to publication so that they could write up their stories ahead of time (I used to do this in my first incarnation as a newswire reporter back when I was young.) These secure briefings are no longer possible so the ONS is now releasing the most market-sensitive statistics in the early morning. These are:
- Quarterly and monthly GDP (including the services, production, construction and trade data)
- Quarterly national accounts (including balance of payments)
- Consumer & producer prices
- Labor market overview
- Retail sales; and
- Public sector finances
Today we get the first of that list.
The ONS explained the reason for the earlier time: “This is before UK markets open and so all the information will be in the public domain before UK trading starts.” This is a somewhat out-of-date view of how the markets work — just because the London Stock Exchange (LSE) doesn’t officially open until 8 AM local time doesn’t mean trading isn’t going on. I know from my own career in Tokyo that someone is making a market in UK stocks and bonds around the clock, even if spreads are wider when no one is in the office in London. Of course you can trade CFDs 24/5 with BDSwiss!
Anyway, since it is highly unlikely that I get this comment written and distributed by 7 AM London time, I’m going to write about these indicators in the previous day’s comment. I’ll repeat the forecasts in the daily table but I won’t repeat the text and graphs.
Britain’s short-term economic indicator day is Thursday. That’s the day we get GDP, industrial & manufacturing production, and trade, all at the same time.
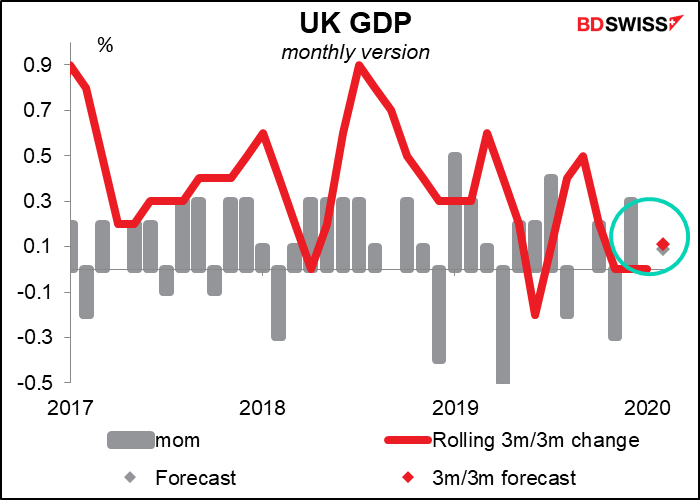
Britain didn’t go into the maelstrom in particularly robust shape. The 3m/3m change in GDP was zero for three consecutive months. January alone was 0% mom. For February, the country is expected to have just eked out a rather tepid +0.1% expansion, both on a mom and 3m/3m basis. Probably the low level of growth was due to concerns over Brexit. Ha! How quaint and innocent those concerns seem now. There was talk of shortages of critical medicines, but no one dreamed that they’d be converting a London conference center into an emergency hospital, as has actually happened.
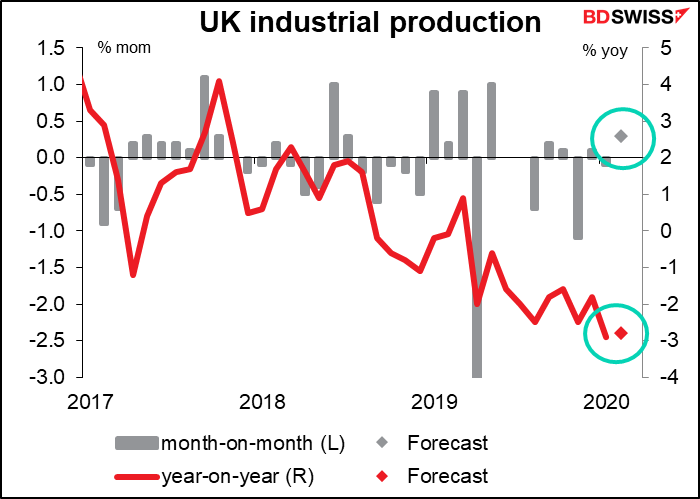
UK industrial production is forecast to show a small mom rise in February, but that would be just enough to keep the yoy rate of decline steady. Heaven knows what the March figure will look like.
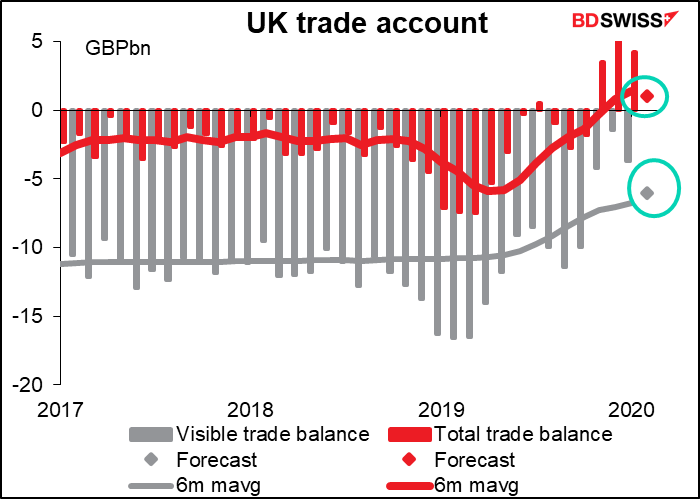
And the total trade balance is expected to remain in surplus, although nowadays we have big questions about this data since it seems to be distorted by the movements in gold, which have been quite peculiar recently.
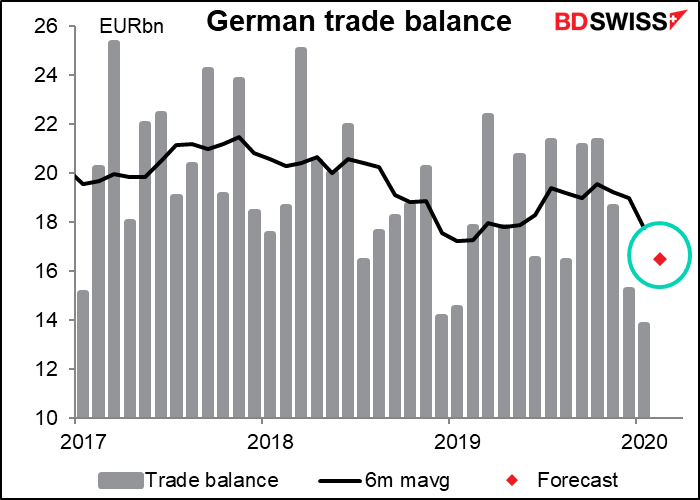
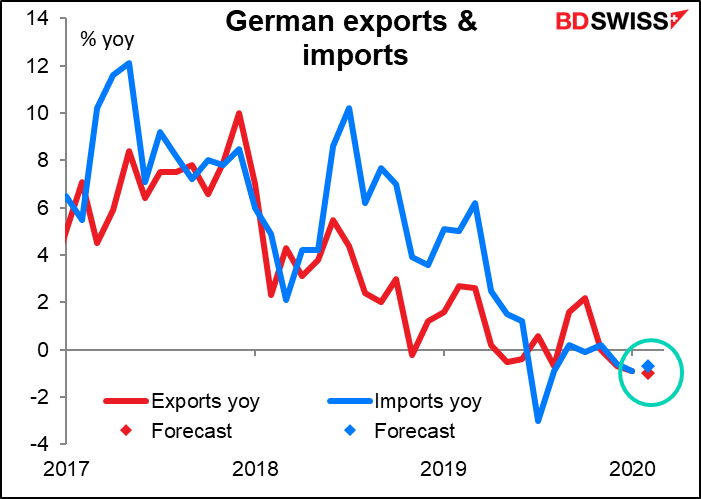
German trade data comes out at the same time. That country’s trade surplus is expected to rise, although just enough to be in line with the trend rate of decline. Both exports and imports have been falling recently; my guess is that this trend continued in the latest month as activity slowed globally.