

Commitments of Traders (CoT) report
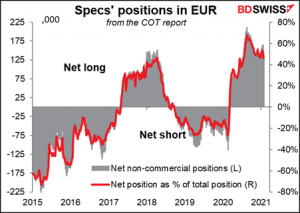
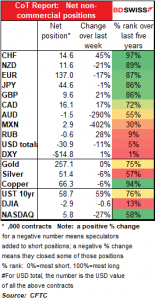
Speculators got caught out by the dollar’s recovery last week and cut their short USD positions. The biggest move, as usual, was in EUR, where the net long position was cut by some 28.3k contracts (17%) through both a decrease in longs and an increase in shorts. The net longs as a percent of total contracts has fallen in line and is now the lowest it’s been since July, showing a decline in the market’s conviction in the long EUR trade.
Other noticeable trimmings were in NZD and AUD, where specs flipped from +771 contracts to -1,467.
But some cases went the other way: CHF and CAD net longs increased noticeably, although in the case of CAD it was more a result of shorts being cut rather than longs being added to. And DXY holdings barely changed.

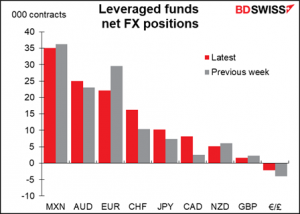
Hedge funds also cut their EUR positions a lot, as well as their MXN position, which is still their biggest net position. But they increased their net longs in other currencies, noticeably CAD and CHF.
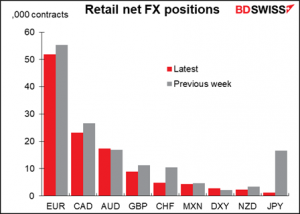
Retail investors cut almost all their currency positions while increasing their long DXY.
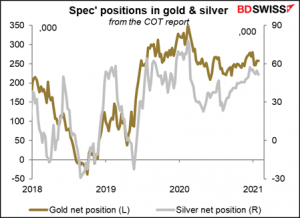
Speculators’ positions in gold were little changed, while silver longs fell by 5.6% despite all the publicity from wallstreetbets.
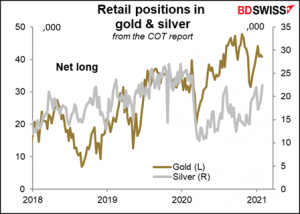
Retail investors on the other hand increased their silver long positions by 18.4%.
Risk reversals (RRs)
Most RRs moved toward zero, meaning that the price of puts and calls became more even – less conviction in the trade, less insurance against a big move. The major exception was EUR/JPY, a negative RR that became more negative (i.e., EUR/JPY puts gained relative to EUR/JPY calls).


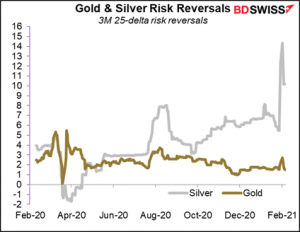
The silver RR jumped on Friday to 12.4 from 7.8 and rose further to 14.3 on Monday, but then fell after that. It ended the week lower than it was a week earlier (10.2 vs 12.4) but almost double what it was two weeks earlier (5.8). This shows a big increase in demand for silver calls.
Implied Volatility: down across the board
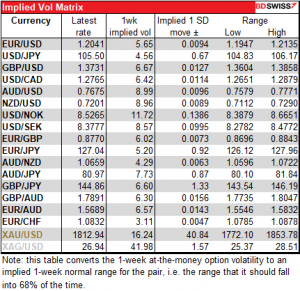
Implied volatility of all the currency pairs that we follow fell, particularly the commodity currencies. The market expects less excitement this week than it did last week. Nonetheless the commodity currencies are expected to remain the most volatile.


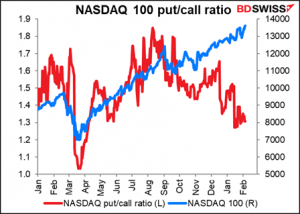
Put/call ratios
The put/call ratios for the S&P 500, NASDAQ and DAX were all virtually unchanged on the week, showing little change in investors’ views on stocks.


The Bloomberg composite call index fell though, showing some diminishing of the speculative fever that has been gripping the stock market recently. Still it was 94% higher in the first week of February than it was in the same period a year earlier.

Explanations and definitions:
The Commitments of Traders (CoT) report, from the US Commodity Futures Trading Commission, presents data on all the futures markets in the US. The data is taken on Tuesday and is released on Friday evening in the US.
For the financial futures, such as currencies, there are three broad classifications of traders. Professional traders are separated between “commercial” and “non-commercial” participants “Commercial” accounts are those that largely using futures to hedge their positions. “Non-commercial” accounts are largely those that are using the futures to speculate in the markets, such as hedge funds, asset managers, and individual traders. We refer to them here as “speculators”. There is another category, “non-reportable”, that consists of small investors whose transactions are individually too small to report on. We present them here as “retail”.
For the financial futures, the data on professional traders are further broken down into “asset manager/institutional”, which includes pension funds and insurance companies – so-called “real money” investors – and “leveraged funds”, which are typically hedge funds and other types of speculators. (There are other categories as well, but we don’t cover them here.) These categories do not necessarily add up to the “non-commercial” figure because of overlap.
The full CoT report includes data on both futures and options. We use only the data on futures.
The Risk Reversal (RR) is a gauge derived from the FX options market of whether the market thinks there’s a greater chance of a currency pair rising or falling. If the market thinks it’s more likely that the pair will rise, then the RR will be positive; if falling, then negative. The more positive (negative) it is, the greater the chance that the market places on the pair rising (falling). Formally speaking, the risk reversal is the implied volatility of the calls minus the implied volatility of the puts.
Implied volatility is just what it says: the level of volatility that’s implied in the price of the options. From looking at the volatility that’s implied in the one-week options, we can calculate what the market is assuming will be the usual range for the week (the range that the price will stay in 68% of the time). Note: the one-week implied volatility is expressed as an annualized figure and so can’t be used directly to calculate the implied one-week range.
Put/Call ratio: The put/call ratio is the same concept of the risk reversal, but uses trade volume instead of price. It shows the number of puts that have been bought on a market index (in this case) or a stock divided by the number of calls. Note: the direction of the signal that this gives is the opposite of the risk reversal. That is, when it’s positive, it means more puts are being bought than calls, which means there is more of a demand for downside protection than for upside.


