Previous Trading Day’s Events (01.03.2024)
- Eurozone’s inflation saw a drop last month but underlying price growth remained stubbornly high. This might hold elevated rates for longer.
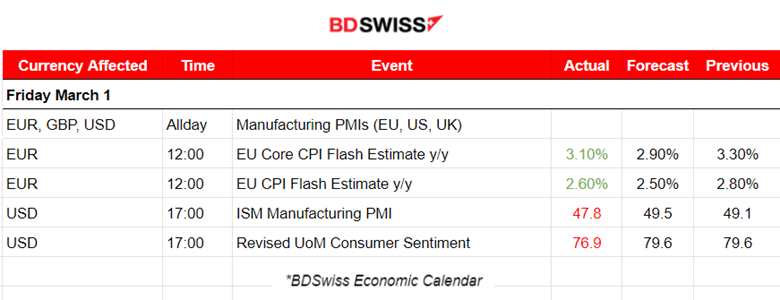
Inflation across the 20-nation Eurozone fell to 2.6% in February from 2.8% a month earlier, just shy of expectations for 2.5%, data from Eurostat. However, crucial core figures only declined to 3.1% from 3.3%, missing expectations for 2.9% and holding uncomfortably above the ECB’s 2% target.
The ECB has kept its deposit rate at a record high of 4% since September.
Markets now see around 90 basis points of rate cuts this year with the first move coming in June, a date that has been mentioned by a host of policymakers, too, as a reasonable start for rate cuts.
Source:
https://www.reuters.com/markets/europe/dip-euro-zone-inflation-bolsters-case-ecb-easing-2024-02-29/
______________________________________________________________________
Winners vs Losers
EURJPY is on the top with 0.30% weekly gains followed by USDJPY, AUDJPY. Obviously, the JPY is weakening notably. Gold (and Silver) moved upwards significantly reaching 2.02% gains early this month and is currently leading.
 ______________________________________________________________________
News Reports Monitor – Previous Trading Day (01 Mar 2024)
Server Time / Timezone EEST (UTC+02:00)
- Midnight – Night Session (Asian)
No important announcements, no special scheduled releases.
- Morning – Day Session (European and N. American Session)
Manufacturing PMI releases:
 Eurozone PMIs:
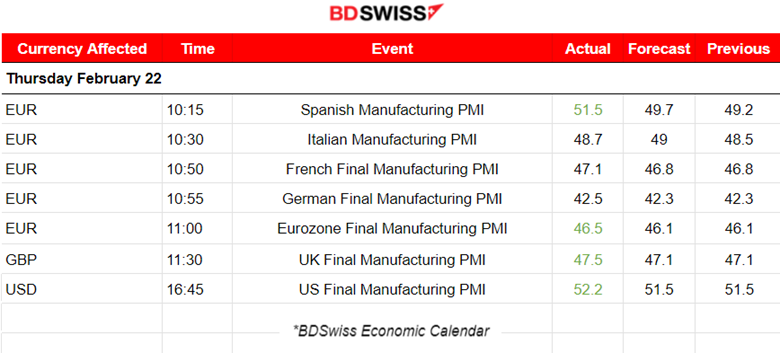
The Spanish PMI was reported to be 51.5, a turn to expansion, with rising new orders and output. Employment growth is also notable. Confidence in the future improved to its highest level for two years.
The Italian manufacturing sector remained in the contraction territory during February with a PMI reported at 48.7 points. Weak demand and lower order numbers caused the reduction of production volumes. Companies increased workforce levels during that time though.
The French production downturn continued falling at its weakest since January 2023. The reported PMI was just 47.1 points, at least an improved one, as contractions in output and new orders cooled significantly. Slower declines in purchasing activity and employment were also recorded.
The German manufacturing sector is worsening. The reported PMI is very low, at 42.5 points indicating that the Eurozone’s largest economy is having a good hit as rates of decline in manufacturing output and new orders have quickened.
The Eurozone manufacturing sector shows signs of recovery even though contraction of the sector continues. New orders and purchasing activity signalled lower rates of decline in close to a year in February. Production levels decreased midway through the first quarter, the rate of contraction held steady though.
UK PMI:
The U.K. manufacturing sector downturn continues. Weak demand and the Red Sea crisis were playing a significant role in the contraction. Disruption in production and vendor delivery schedules due to the Red Sea crisis created difficulties in delivering, driving up costs. Demand also remained weak, with new order intakes falling at the fastest rate since last October.
U.S. PMI:
In the U.S. the manufacturing conditions improve at the fastest pace since July 2022 according to S&P Global’s report. The sector experienced a quicker pace of improvement. A renewed increase in production and a quicker rise in new orders. The reported PMI figure is relatively high in expansion territory, with 52.2 points.
The ISM manufacturing PMI report though has shown different results. A PMI reported in contraction, at 47.8 points. Surprisingly low numbers contradicting the bulk regional manufacturing reports. The ISM manufacturing survey fell to 47.7 in February. The details show production contracted at its fastest rate since last July while new orders dropped back into contraction territory, while the employment component dropped.
Good news for inflation in the Euro area. The annual inflation estimate was reported at 2.6% in February 2024, down from 2.8% in January according to a flash estimate from Eurostat. The core figure was also reported lower, but higher than expected. The EUR depreciated at the time of the release with a moderate shock occurring. EURUSD dropped nearly 20 pips during that time.
At 17:00 the February UMich final consumer sentiment was reported lower, 76.9 vs the expected 79.6. Year-ahead inflation inched up from 2.9% in January, to 3.0% in February. For the second straight month, short-run inflation expectations have fallen within the 2.3-3.0% range.
General Verdict:
- Friday mood but volatility levels remained high in most markets. The dollar was affected negatively, especially after the 17:00 news causing the dollar index to drop and close lower for the trading day.
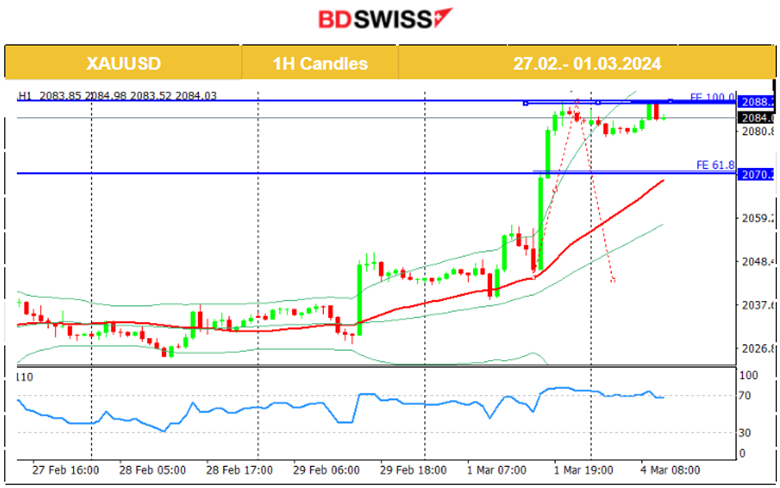
- Gold moved significantly upwards reaching 2088 USD/oz.
- Crude oil moved to the upside as well reaching 80.35 USD/b.
- U.S. indices have also moved upwards on a short-term upward trend.
 __________________________________________________________________
FOREX MARKETS MONITOR
EURUSD (01.03.2024) 15m Chart Summary
Server Time / Timezone EEST (UTC+02:00)
Price Movement
The pair experienced a volatile path around the 30-period MA before the 17:00 U.S. news as the grim Eurozone PMI figures releases were taking place during that time. It unsuccessfully tested the support 1.07980 twice before eventually, during the ISM Manufacturing PMI report and UMich final consumer sentiment report, the pair jumped, crossing the MA on its way up reaching the resistance near 1.08430. Retarcement followed but the pair continued to the upside while being above the MA. dollar depreciation caused the resulting path.
 GBPUSD (01.03.2024) 15m Chart Summary
Server Time / Timezone EEST (UTC+02:00)
Price Movement
The pair experienced a roughly similar path. The GBP was greatly affected by the PMI figure having a more negative impact on the GBP and the pair. The level 1.25990 was the intraday support that the pair reached after a rapid movement to the downside before the U.S. news reports at 17:00. After these reports the USD depreciated greatly causing the GBPUSD reversal and its continuation to the upside as the USD was losing more and more strength until the end of the trading day.
 ___________________________________________________________________
CRYPTO MARKETS MONITOR
BTCUSD (Bitcoin) Chart Summary
Server Time / Timezone EEST (UTC+02:00)
Price Movement
Bitcoin continues to the upside as it breaks more and more resistance. The largest crypto passes 65,000 USD for the first time since Nov. 2021. It is driven by expectations of exchange-traded funds’ robust demand and the upcoming halving event. It noted an Incredible demand from the U.S.-listed Bitcoin ETFs, which began trading on Jan. 11. Bitcoin has jumped about 186% in the last 12 months.
 Crypto sorted by Highest Market Cap:

The crypto market continues to experience incredible performance. Not only bitcoin, all other crypto with high Market Cap see amazing gains. Shiba Inu saw 181.11% gains in the last 7 days so far.
Source: https://www.investing.com/crypto/currencies
______________________________________________________________________
EQUITY MARKETS MONITOR
NAS100 (NDX) 4-Day Chart Summary
Server Time / Timezone EEST (UTC+02:00)
Price Movement
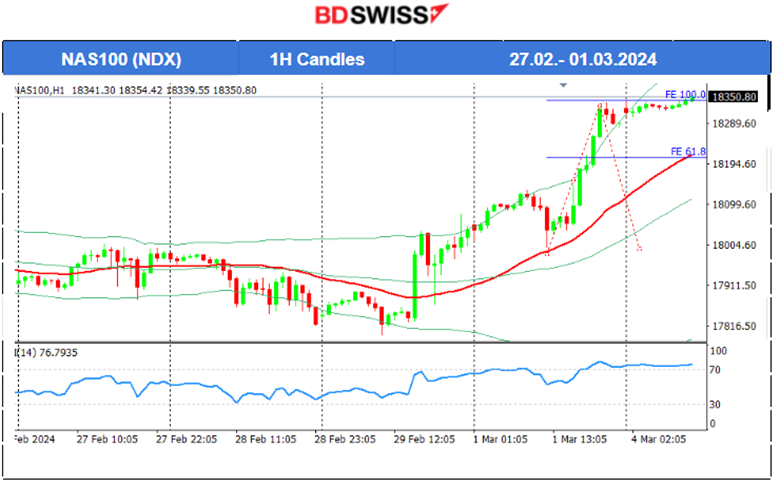
On the 29th Feb, all benchmark indices surged after the PCE report release showing a lower annual figure that caused the dollar to lose strength at that time. The momentum to the upside was strong enough to cause the index to move quite rapidly and further from the MA on its way up. Retracement followed today reaching the Fibo 61.8. A clear short-term uptrend for now. The RSI remains in the overbought area and if resistance holds, indices could see a drop soon. The alternative scenario is a sustainable jump after the NYSE opening that seems not so probable.
 ______________________________________________________________________
COMMODITIES MARKETS MONITOR
USOIL (WTI) 4-Day Chart Summary
Server Time / Timezone EEST (UTC+02:00)
Price Movement
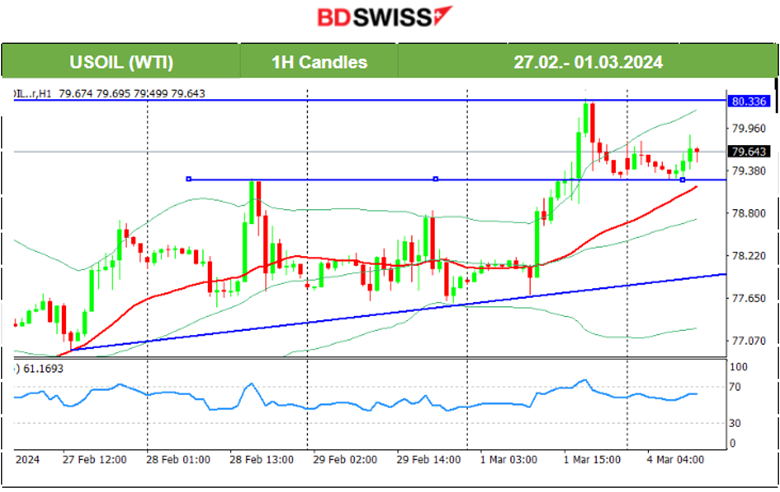
On the 28th Feb, the price was clearly on a short-term uptrend, however, after finding important resistance near 79.20 USD/b it reversed to the mean level at 78 USD/b. A sideways but volatile movement followed and that changed on the 1st March. The price jumped high reaching the resistance at 80.3 USD/b before retracing back to 79.3 USD/b. There is no clear signal in regards to where the price is headed. If the uptrend continues as the support remains strong, obviously the price could reach the high, 80.3 USD/b level, once more.
 XAUUSD (Gold) 4-Day Chart Summary
Server Time / Timezone EEST (UTC+02:00)
Price Movement
Since the 29th Feb, Gold shows this upside momentum with the price moving quickly and unusually upwards since the demand for metals saw an increase lately. The dollar is also showing weakness. Gold should come down if it passes the 2080 USD/oz support level. That would trigger the retracement. The 2088 USD/oz resistance is actually very important. Looking at the daily chart Bollinger Bands for volatility measure it actually tells us that Gold experienced quite unusual high volatility and movement to the upside. The question is, will the resistance 2088 USD/oz hold this week, causing the price to drop?
 ______________________________________________________________
News Reports Monitor – Today Trading Day (04 Mar 2024)
Server Time / Timezone EEST (UTC+02:00)

- Midnight – Night Session (Asian)
No important announcements, no special scheduled releases.
- Morning – Day Session (European and N. American Session)
The Swiss consumer price index (CPI) increased by 0.6% in February 2024 compared with the previous month. Inflation was +1.2% compared with the same month of the previous year. CHF appreciated at the time of the release. USDCHF dropped nearly 25 pips and retracement followed.
General Verdict:
- Monday mood. Absence of important releases however we are expecting volatility levels to grow and retracements to take place after a busy Friday. The dollar currently is not affected greatly.
- U.S. indices show signs of resistance to the upside.
- Gold is volatile but testing important support at this time that could lead to a rapid price drop.
- U.S. oil settled near 79.5 USD/b as volatility levels lowered.
______________________________________________________________


