PREVIOUS TRADING DAY EVENTS – 21 August 2023
“Probably China limited the size and scope of rate cuts because they are concerned about downward pressure on the yuan,” said Masayuki Kichikawa, chief macro strategist at Sumitomo Mitsui DS Asset Management. “Chinese authorities care about currency market stability.”
The yuan became one of the worst-performing Asian currencies.
“We interpret the status quo of five-year LPR as a signal that the Chinese banks are reluctant to cut rates at the expense of rate differential margin,” said Ken Cheung, chief Asian FX strategist at Mizuho Bank.
The central bank stated that it will optimise credit policies for the property sector while coordinating financial support to resolve local government debt problems.
______________________________________________________________________
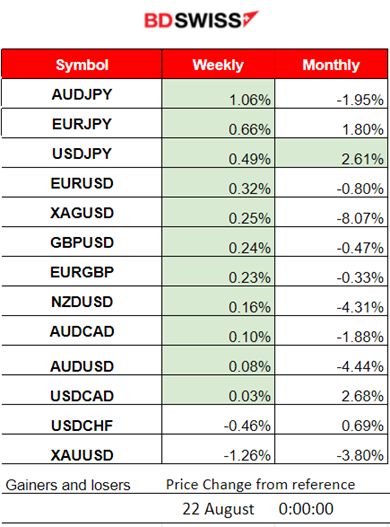
Winners vs Losers
______________________________________________________________________
News Reports Monitor – Previous Trading Day (21 August 2023)
Server Time / Timezone EEST (UTC+03:00)

- Midnight – Night Session (Asian)
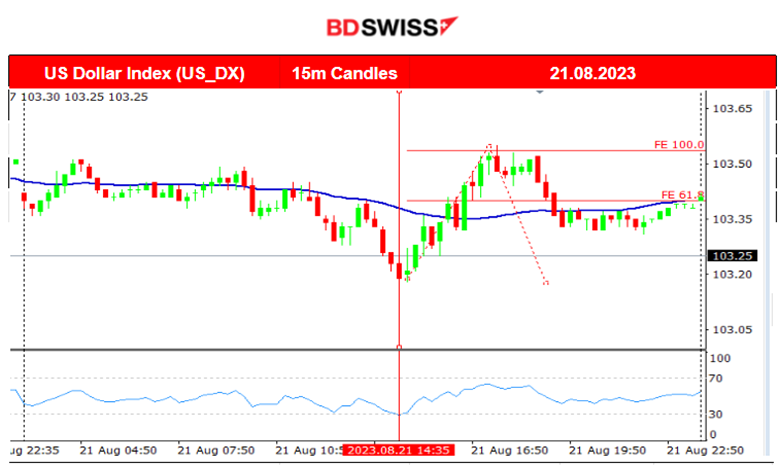
The benchmark lending rate set by the People’s Bank of China decreased to 3.45%. No major impact was recorded for CNH/CNY or AUD pairs.
- Morning–Day Session (European and N.American Session)
No important news announcements, no special scheduled releases
General Verdict:
____________________________________________________________________
FOREX MARKETS MONITOR
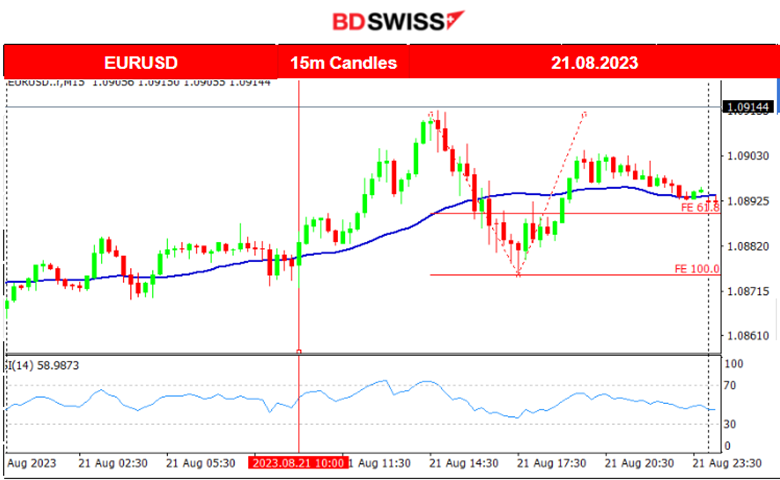
EURUSD (21.08.2023) Chart Summary
Server Time / Timezone EEST (UTC+03:00)
Price Movement
The pair was showing low volatility before the European Market opening. That changed after 10:00 when it eventually started to move more to the upside until it found resistance at 1.09130. Price then reversed and crossed the 30-period MA on its way down finding support at 1.08755 before retracing back to the mean.
___________________________________________________________________
CRYPTO MARKETS MONITOR
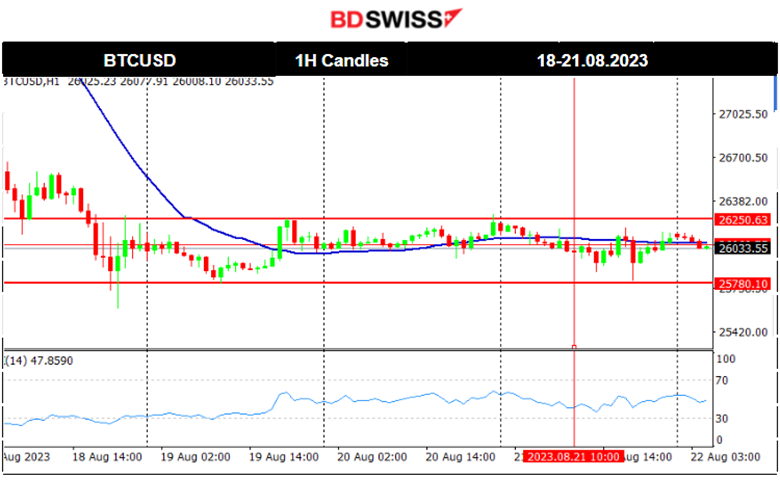
BTCUSD (Bitcoin) 4-Day Chart Summary
Server Time / Timezone EEST (UTC+03:00)
Price Movement
Bitcoin fell recently way below the 30K USD support and now is settled near 26K. In the last 4 days, the price seems to be in a consolidation phase until the next big move. The market is ranging between 26250 and 25780. No scheduled news releases today affect the USD much, therefore there is no expectation of a break. Other fundamental factors affecting the blockchain industry could push it to new levels but are not apparent. While investors are in a risk-off mood, as the U.S. stock market suggests, and the USD keeps on strengthening, bitcoin will probably continue to fall.
Low volatility during 19-20 August is due to weekend market conditions.
EQUITY MARKETS MONITOR
NAS100 (NDX) 4-Day Chart Summary
Server Time / Timezone EEST (UTC+03:00)
Price Movement
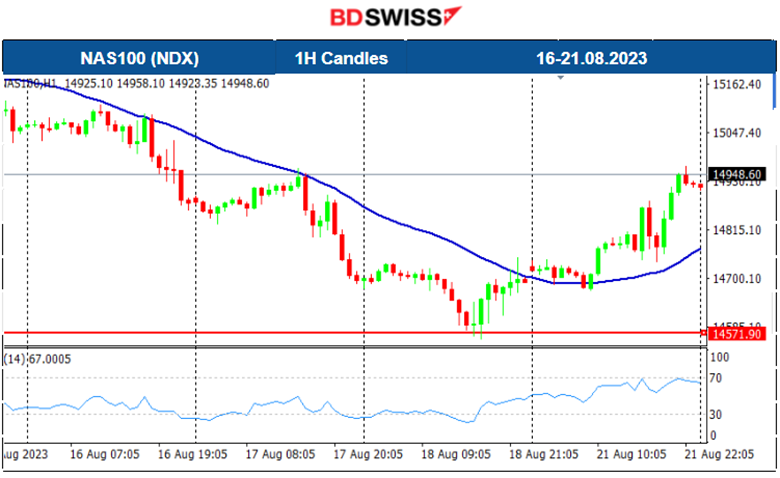
The index remained below the 30-period MA for days, moving steadily downwards. Yesterday though it finally reversed, crossing the 30-period MA on its way up. Should this be considered a sign of a reversal and the start of an uptrend? Of course not. Looking at the other benchmark indices, only the S&P500 is in line with this path. They all show volatility beyond the typical average but we need more data to suggest that a start of an uptrend is on. 14571 serves as an important support and the index is probably going to retrace back to the mean before showing its true direction. That could be the case unless stocks are pushed more and the index crosses over the 14970 level. This could cause the index to move further upwards before eventually retracing.
______________________________________________________________________
COMMODITIES MARKETS MONITOR
USOIL (WTI) 4-Day Chart Summary
Server Time / Timezone EEST (UTC+03:00)
Price Movement
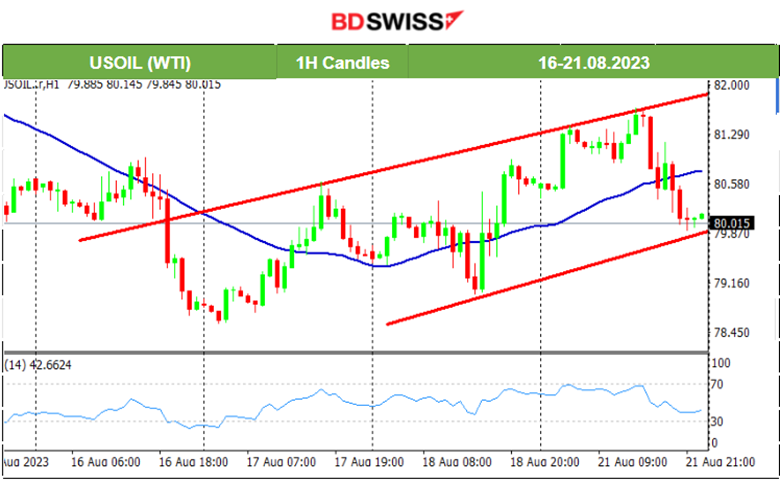
The 81.66 USD/b was Crude’s price peak this week. It moves with high volatility around the 30-period moving average, thus showing these high deviations from the mean. It fell from that peak yesterday crossing the MA on its way down and reaching the 80 USD/b level. 78.90 USD/b serves as the next support. Retracements are more probable to happen, or even more reversals in these conditions.
XAUUSD (Gold) 4-Day Chart Summary
Server Time / Timezone EEST (UTC+03:00)
Price Movement
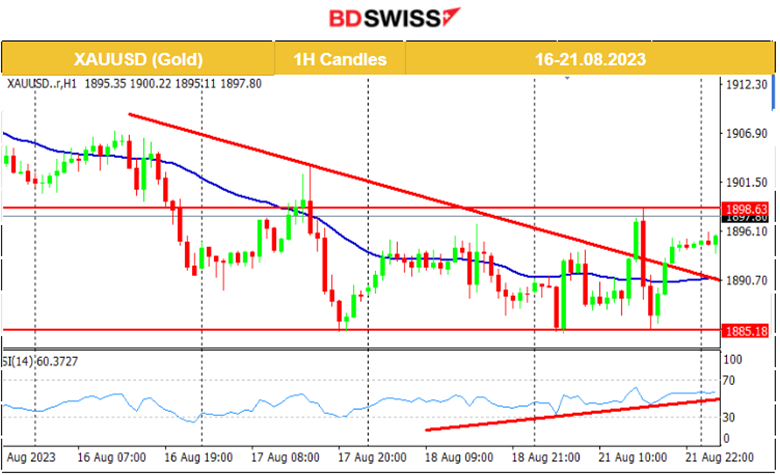
Gold finally showed signs of reversing. 1885 USD/oz serves as an important support level. The RSI shows signs of bullish divergence. The price formed a triangle that it seems to have been broken to the upside. There is a great potential that it will continue moving upwards since it broke the upward triangle band. 1899 USD/z is the resistance that must be broken to push the price further upwards. Next resistance at 1903 USD/oz.
______________________________________________________________
News Reports Monitor – Today Trading Day (22 Aug 2023)
Server Time / Timezone EEST (UTC+03:00)

- Midnight – Night Session (Asian)
No important news announcements, no special scheduled releases
- Morning–Day Session (European and N.American Session)
Today we are not expecting major shocks but the USD will be affected probably by the news at 17:00. Existing Home sales figures refer to the previous month’s sales and they are expected to be reported lower. This is in line with the expectation that rate hikes are negatively affecting spending and investment.
More negative expectations for the figure of the Richmond Manufacturing Index indicate worsening conditions again in line with the current monetary policy effect on U.S. business conditions.
General Verdict:
______________________________________________________________


