
Rates as of 05:00 GMT

Market Recap
The Fed’s rate decision yesterday – to hike by 75 bps – was in line with market expectations and with what various members of the rate-setting Federal Open Market Committee (FOMC) had suggested before the meeting. This is “right in the range of what (the FOMC) thinks is neutral,” according to the Fed.

The key points came out in the press conference. While Fed Chair Powell stressed that the Fed remains totally committed to fighting inflation despite signs of weaker growth, he did not try to scare the market with what they were likely to do in September and after. Rather, he emphasized that the Fed will remain “data-dependent,” that is, hiking is not on a pre-determined cycle but will be decided independently at each meeting.
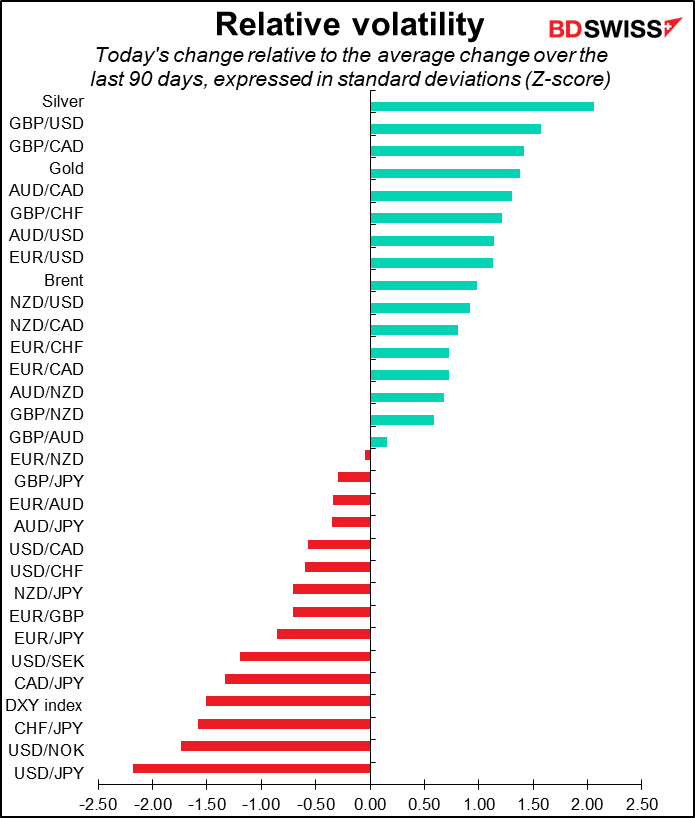
Despite the Fed’s continued insistence that inflation is still too high and more hikes will be necessary – something that everyone knew already — markets instead latched onto the fact that the Committee was aware of the signs of slowing growth in the economy and would therefore slow the path of tightening at some point. As a result the market lowered its estimates for future rate hikes by around 7 bps. This contributed to USD weakness, while the narrower expected spread with Japan – where rates aren’t going anywhere any time soon – helped to support JPY. Precious metals, which are adversely affected by both a stronger dollar and higher interest rates, had a great day. Silver in particular saw a 2 standard-deviation move upward.


The market is now even more convinced that the fed funds rate will end the year around 3.25%-3.50%. That would be 100 bps higher than it is now, implying a 50 bps hike in September and 25 bps each in November and December. IE a notable slowdown in the pace of rate hikes. Note that the market thinks if it doesn’t hit that level it’s more likely to be lower than higher (red bars). The day before the meeting the thinking was the other way around (blue bars).

The statement highlighted that growth has “softened,” but underlined continued labor market strength and the risks of high inflation. Chair Powell didn’t rule out another 75 bps hike in September but rather said it would be based on the data. There are two more CPI inflation and employment reports due before the Sep. 21st FOMC meeting, which the market apparently assumes will show some cooling in inflationary pressure and demand for labor (I hope).
Chair Powell did say that as policy tightens further, it would become appropriate to slow the pace of rate increases, but he provided little guidance on when that might be. He did note that the June Summary of Economic Projections (SEP), which shows rates getting to between 3%-3.5% by the end of the year and a terminal rate of 3.8%, was probably still the best guide.
In these uncertain times the Fed, like the European Central Bank (ECB), has been keen on preserving optionality and remaining “nimble” so that it can respond to the data as it comes in. Officials therefore seem to be avoiding clear forward guidance on policy moves, a 180-degree reversal of their policy during the pandemic, when virtually all central banks gave explicit forward guidance that included either specific times (“we will hold rates at XXX until such-and-such a time”) or criteria (“we will hold rates at XXX until inflation is at YYY%”).
By the way, before anyone gets carried away with how the Fed is tightening and choking off growth, let me ask: is a 2.5% fed funds rate really “neutral” when inflation is 9.1% yoy? Before the 2008 Global Financial Crisis, the “real” fed funds rate – fed funds minus the CPI – averaged 1.7%. Even after yesterday’s rate hike it’s an astonishingly low -6.6%. I think they’ll have to hike much much higher in order to get inflation back to 2%. That’s why I remain positive on the dollar.

Today’s market

Note: The table above is updated before publication with the latest consensus forecasts. However, the text & charts are prepared ahead of time. Therefore there can be discrepancies between the forecasts given in the table above and in the text & charts.
The European day starts out with German’s harmonized index of consumer prices (HICP), the Eurozone-wide way of calculating C PI. The month-on-month rate is expected to pick up but the year-on-year rate to slow one tick.
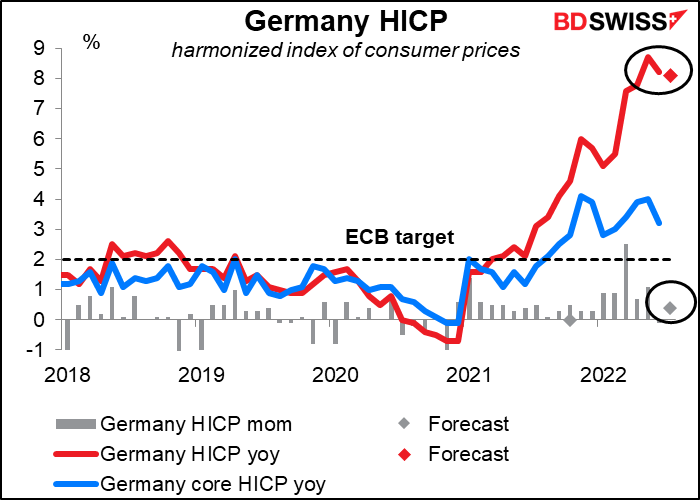
The figures do mask some recent slowing in the rate of inflation – if we take the three-month change and annualize it, it started to come down last month and is expected to decline sharply this month. But I’m not sure people pay much attention to that calculation.

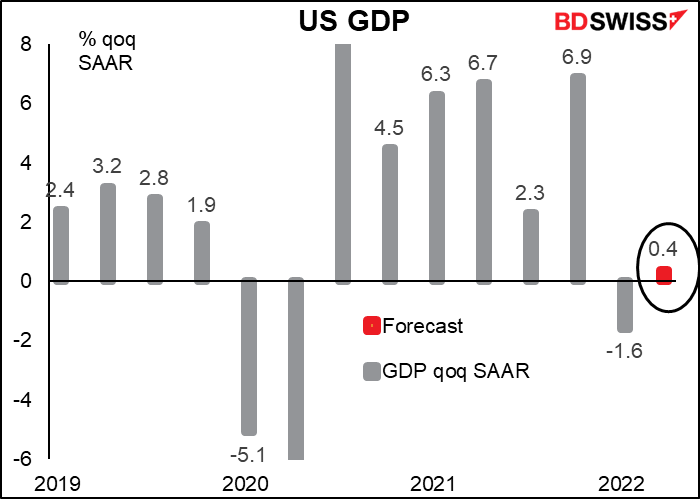
Next up is US GDP. It looks like the US will avoid the common definition of a recession, which is two consecutive quarters of contracting output. (That’s not how recessions are defined in practice though; the US National Bureau of Economic Analysis has a committee that decides retrospectively when the US was in recession.)
I have to say though that the forecasts on Bloomberg range from -1.6% qoq to +2.0% qoq. So some people think there is a chance of a technical recession. I think a negative print would be a big surprise to the market and would cause USD to fall sharply, as it might limit the Fed’s ability to hike rates. But of course a higher-than-expected figure would probably do the opposite.
Initial jobless claims will be announced at the same time. These are sort of a “glass-half-empty” or “glass-half-full” test. I’ve heard at least one well-known economist argue that the US is almost in recession because jobless claims are at an eight-month high (week of Nov. 12th), which is absolutely true.
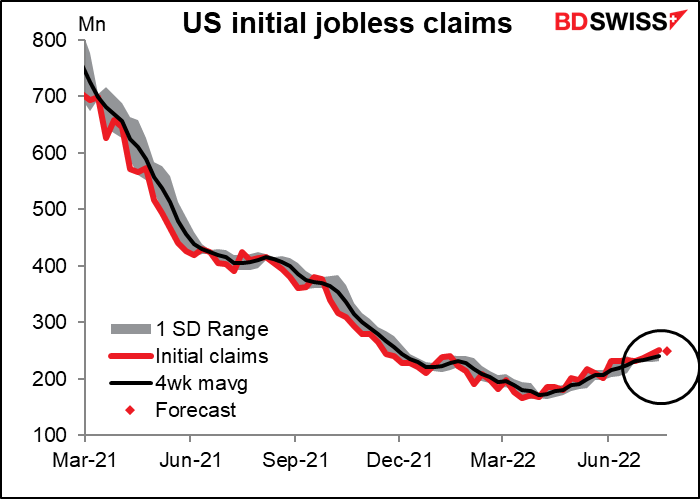
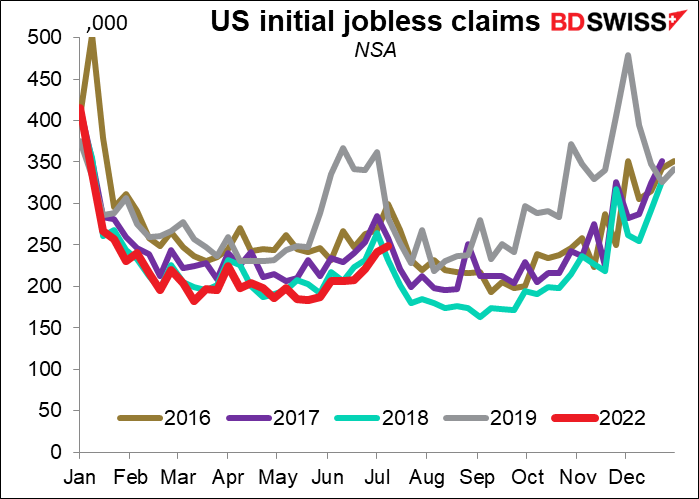
On the other hand, maybe claims were pretty low eight months ago and rising back to that level is no big thing? If we look at the seasonally unadjusted figure, it’s tied for the lowest level for this time of year in the four years before the pandemic. And of course the US economy has expanded and the population and the number of workers has risen since 2016, too, but the figures don’t adjust for that.
Then that’s all the excitement for today until Tokyo wakes up and it’s time for the usual end-month data dump from Japan.
The Tokyo CPI is expected to creep higher by 10 bps. Such a sluggish rise would only confirm the Bank of Japan’s view that inflation isn’t sustainably over its 2% target and justify the BoJ’s decision not to change policy at all. This would be yet another green light to sellers of JPY (buyers of USD/JPY).
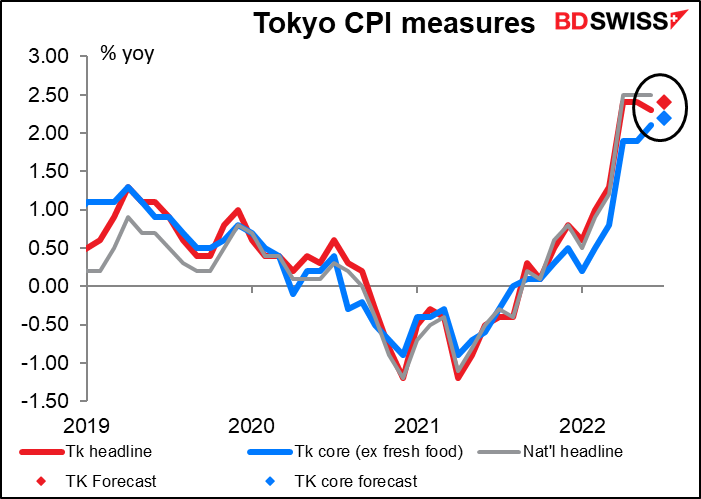
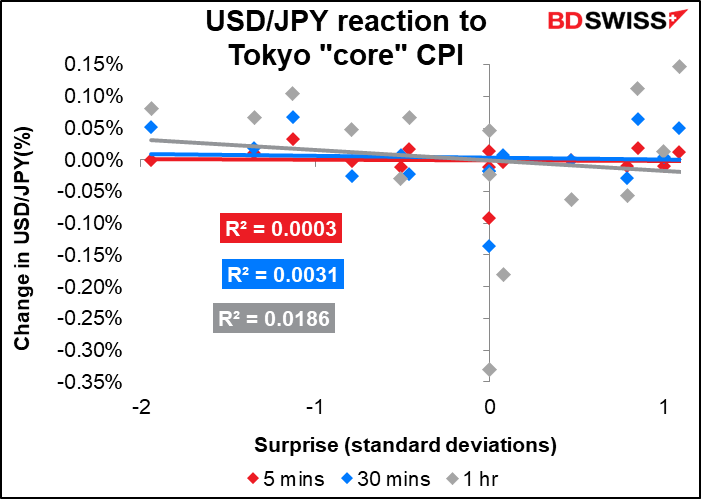
In most countries the CPI is among the most important economic releases for the currency, but in Japan’s case there doesn’t seem to be much reaction. The “Japan-style core” measure of inflation, which excludes fresh foods, has the highest Bloomberg relevance score but no statistically significant connection with the subsequent movement of the currency. That’s probably because no one expects the Bank of Japan to take any action or for bond yields to change based on the figure.
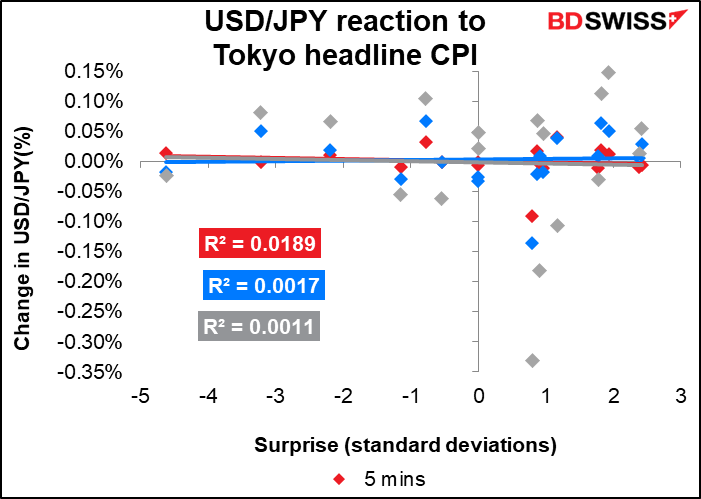
The headline figure is hardly better.
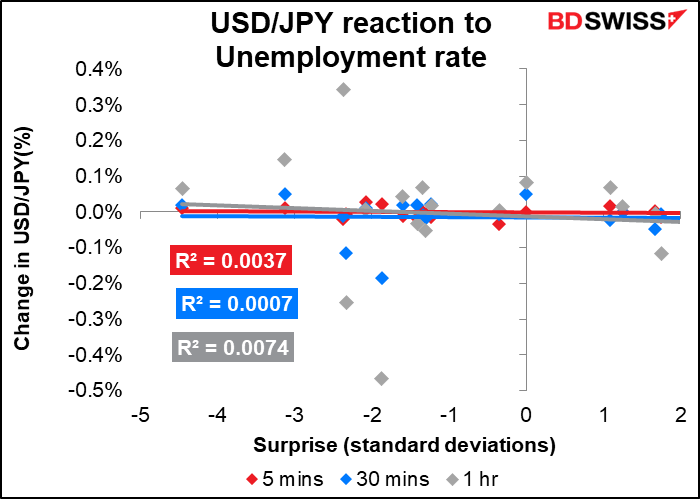
Japan’s unemployment rate, which must win some award for being the most boring statistic in widespread use, is expected to tic down one tick, while the job-offers-to-applicants ratio is expected to move one tick higher. Both are the direction we want to see, but only at a gradual pace to say the least. In any case I don’t think news like this will set the markets on fire.

Although the figure has a very high Bloomberg relevance score, the FX market at least doesn’t seem to pay that much attention to it.
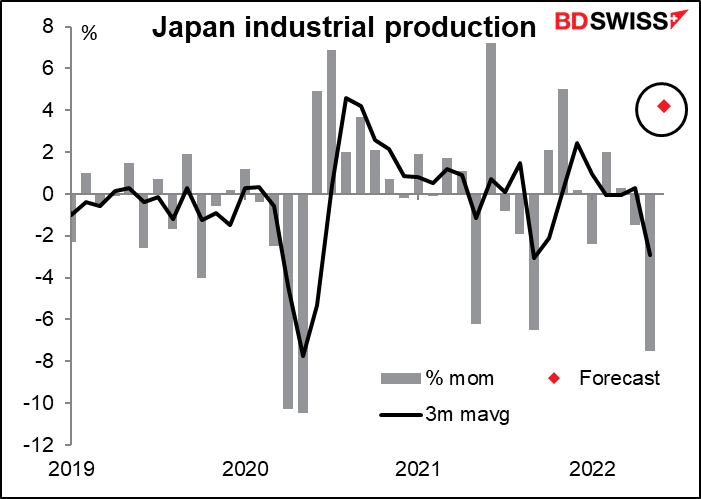
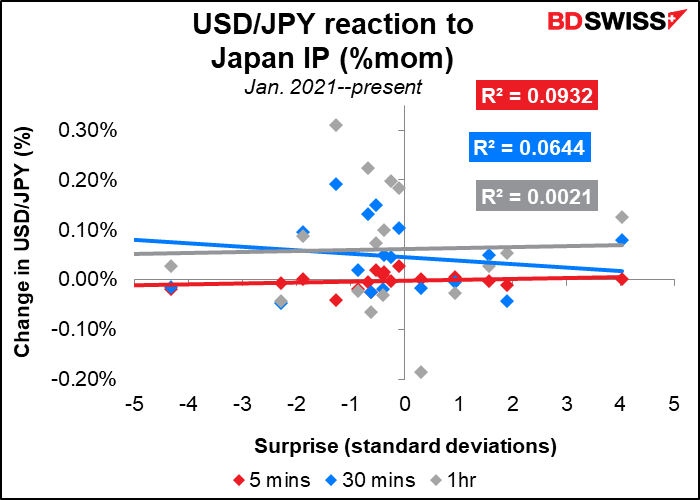
Japan’s industrial production is the most closely watched of these indicators, although I’m not so sure it’s key for the FX market – in other countries where the central bank does something every decade or so the CPI would be more important. The index is expected to be up sharply on a month-on-month basis, breaking the recent downtrend thanks to higher export-related shipments. But this would still leave production down 7.1% year-on-year and 7.3% below pre-pandemic levels.
The subsequent movement of the yen doesn’t seem to have much direct connection with the IP figures. But then again, it may just be that with so much data coming out at nearly the same time, the impact gets lost (although the IP figures do come out 20 minutes after the CPI and employment data do).
Moving right along, Australia’s private-sector credit is expected to grow at about the same pace it did the month before. Households and businesses alike have borrowed more in response to the Reserve Bank of Australia’s record-low interest rates. But as the RBA unwinds its policy stimulus, the housing market is starting to turn down, which will eventually have knock-on effects on business. We should start to see credit growth slowing noticeably.


