Rates as of 05:00 GMT
Market Recap
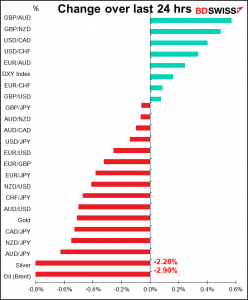
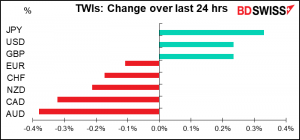
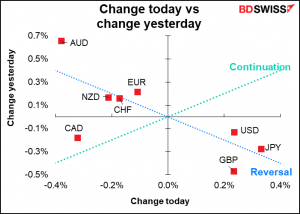
Largely a reversal day – note how most currencies line up along the blue dotted line in the second graph. That’s the 450 reversal line, where today’s change is the same as yesterday’s but with the opposite sign. After a few days of “risk-on,” yesterday was “risk-off,” with the Euro STOXX 50 down 0.6%, S&P 500 -0.7%, and NASDAQ off 1.7%.
The cause was – need I say it? – the virus. No particular news, but just the usual fight between fear and greed. While the new Omicron variant seems to be less severe than previous variants, it also seems to be more easily transmitted. That could out weigh the benefits as more people being sick means more people being out of work and ultimately being hospitalized, which could require action from the authorities. There was an unnerving report a few days ago that the Omicron variant spread between two fully vaccinated travelers across the hallway of a Hong Kong quarantine hotel without the two people ever coming into direct contact – just air wafting between the two rooms was enough. Ouch!
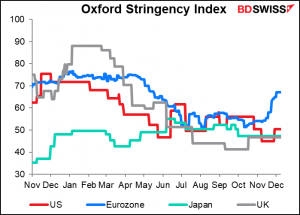
As a result we’re starting to see more stringent measures being taken in Europe, the US, and the UK (the latter of which aren’t reflected yet in this graph). That’s likely to weigh on activity.
As stock markets fell, most bond markets rallied (that is, yields moved lower). Canadian bonds were the standout here as oil moved sharply lower. Obviously people won’t use as much oil if they’re not allowed to go anywhere.
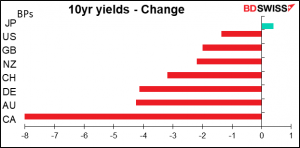
It was notable that even with the hit to oil and the sharp drop in Canadian bond yields relative to US bond yields, CAD still outperformed AUD. This is yet more proof that AUD is trading as a surrogate for global growth.
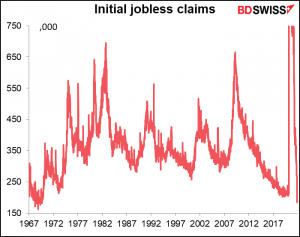
Separately, we had some good news about the US labor market yesterday (although it doesn’t seem to have had much impact on the markets). Initial jobless claims fell to their lowest level since Sep. 1969.
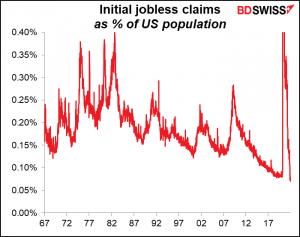
Of course the US population was a lot smaller in 1969 than it is today. Adjusted for population, initial jobless claims were at a record low. Is that a reflection of the hot job market or global warming? The unusually warm weather is enabling construction workers to keep working longer than usual. This is boosting the seasonally adjusted series, which is what we’re referring to here.
GBP was up but I remain cautious. There’s talk of a backbench rebellion against PM Boorish Johnson by members of Parliament (MPs) of his own party. Johnson has been stumbling from scandal to scandal to mishandling to mistake. Voters are upset about the additional lockdown measures, which were conveniently announced just as the press was raising a hew and cry about a leaked video of a 10 Downing Street Christmas Party last year when such gatherings were supposedly banned (but apparently not for those making the bans). Could it be that he introduced “Plan B” to distract from the scandal? It’s unlikely but not beyond speculation.
Rumor has it that his MPs could mount a vote of “no confidence” against PM Johnson if things don’t settle down soon. If he lost, it would only cause a Conservative Party election for a new leader, not a General Election for a new Parliament – that would happen if the opposition party puts forward a Vote of No Confidence and the PM loses. Nonetheless, more political disarray in Britain can’t be good for the currency.
Today’s market
Note: The table above is updated before publication with the latest consensus forecasts. However, the text & charts are prepared ahead of time. Therefore there can be discrepancies between the forecasts given in the table above and in the text & charts.
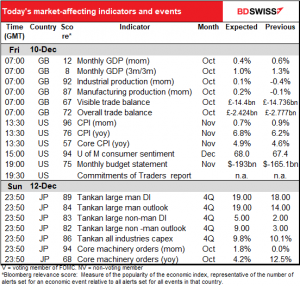
The focus today will be on the US consumer price index (CPI). Although the Fed in theory prefers the personal consumption expenditure (PCE) deflators to gauge inflation, the CPI is politically more important because that’s what most people understand to be “the inflation rate.”
It’s expected to soar, which is not good news for the Fed. This is why the fed funds futures are pricing in more than 70% chance of a rate hike by the May meeting and one by June for sure.
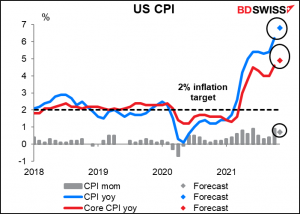
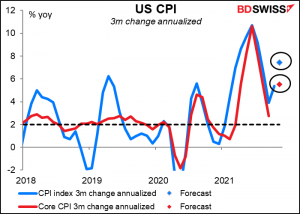
The forecast headline rate of inflation, 6.8% yoy, would be the highest inflation since March 1982. Just FYI, the effective fed funds rate that month was 14.7% — not 0.08% as it is today.
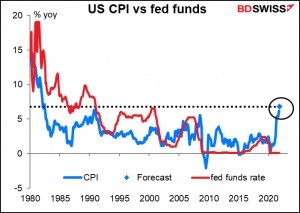
At the same time, 10-year Treasuries back then were 14.2% whereas today they’re 1.5%. That’s pretty incredible too. Why the US bond market hasn’t blown up must be one of the Seven Wonders of the Financial World.
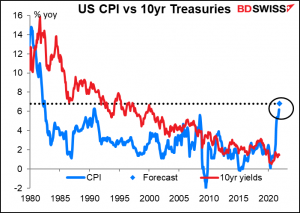
And for those who, like me, still cling to the now-“retired” idea that these higher inflation rates are just “transitory,” the three-month change in CPI annualized is expected to turn up again. Oops!
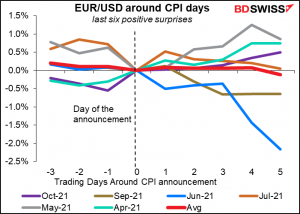
What’s the market reaction to the CPI? Not what you’d expect. The CPI has been higher than the market consensus expectation for seven out of the last nine prints. One would normally expect the dollar to strengthen on this news, as it makes it more likely that the Fed will hike interest rates. Oddly enough though, EUR/USD rose four times out of the last six of those times, that is, the dollar weakened.
My guess is that before the Fed was seen to be in a mood to taper down its bond purchases and eventually hike rates, higher-than-expected inflation just meant lower-than-expected real interest rates in the US. That would’ve been negative for the dollar. But now that the Fed is clearly in the mood to reduce its accommodation, the market’s reaction to higher-than-expected inflation may well be different.
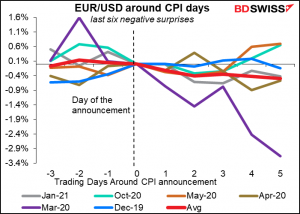
On the other hand, EUR/USD generally fell, i.e. the dollar gained, when it missed expectations.
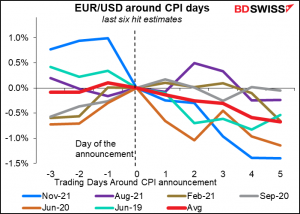
The clearest trend was when it hit expectations, which have usually been for higher rates. Then the dollar consistently rose.
Elsewhere, US consumer sentiment is expected to remain weak. The headline figure (consumer sentiment) is forecast to improve a bit, but expectations are forecast to fall further. Continued problems with the virus probably have a role in this…
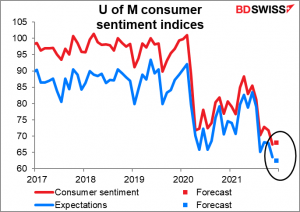
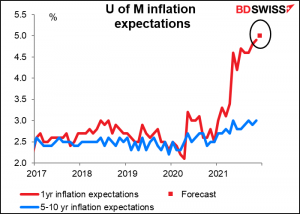
…but rising inflation expectations may be partially to blame as well. The forecast rate of 5.0% would be the highest reading for this indicator since July 1982. This helps explain why the Fed has pivoted away from its focus on jobs to focusing on inflation.
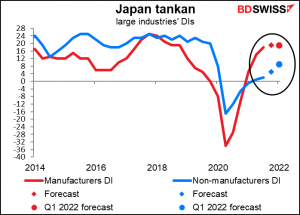
Then early Monday at the beginning of the Asian day we get the Bank of Japan’s quarterly Short-Term Survey of Economic Conditions, universally known by its Japanese acronym, the tankan. This survey is probably the most important economic indicator in Japan. Thousands of Japanese companies are asked about current trends and conditions in their business and their industries as well as their expected business activities for the next quarter and year.
(A word of explanation in case you’re not familiar with the tankan)
Most of the questions are about whether conditions are getting better or worse, and companies can answer either 1) “better,” 2) “no change,” or 3) “worse.” The BoJ then calculates a diffusion index (DI) by taking the percentage of companies that choose #1 (good, favorable, accommodative, etc.) minus the percent that choose #3 (bad, unfavorable, severe, etc.). The higher the number, the better things usually are, although in some instances, such as production capacity, a lot of excess capacity is not good for the economy.
The result is a dizzying blizzard of data, the most important of which is the business conditions DI for large manufacturers. These companies are the driving force of the Japanese economy (and stock market), the main exporters, and the ones that invest the most. The market looks at three things: 1) what the DI is and how it compares to the previous quarter; 2) how the DI for the current quarter compares with what the firms predicted it would be in the previous tankan (the revision rate); and 3) the projection for the next quarter. The latter statistic is particularly important because it gives an insight into how these companies expect conditions to develop. This is important because if the companies are optimistic about the future, they may step up their investing and hiring people even if current conditions are not so good.
(end of explanation)
The figures this quarter are expected to be mixed: services good, manufacturers not so good. The large manufacturers’ DI is expected to be up only 1 point and the forecast for Q1 next year is for no change from that level. In other words, manufacturers appear to be peaking out at the recent peak, the Q3/Q4 2018 level. Services on the other hand are expected to show more improvement this quarter and expect continued improvement in Q1 next year, but to remain well below their pre-pandemic level.
I’d say that figures like these would probably be neutral for the markets. They would just confirm the story we see from the purchasing managers’ indices and other indicators, such as industrial production and the tertiary sector index. Accordingly I don’t expect this will have much effect on markets if it comes in as expected.