PREVIOUS TRADING DAY EVENTS – 07 April 2023
Announcements:
The figures show the early stages of a slowdown in jobs as the increase is way lower than the previous one. Note that this result followed the Federal Reserve’s efforts to slow labour demand in order to bring inflation down.
“Everything is moving in the right direction,” said Julia Pollak, chief economist for ZipRecruiter. “I have never seen a report align with expectations as much as today’s over the last two years.”
The stock market was closed for Good Friday, however, the indexes experienced a rise in value. The futures had increased after the report and treasury yields also moved higher.
The Federal Reserve (Fed) states that they are committed to bringing inflation down and they expect to keep interest rates high. Analysts now expect the Fed to implement one last quarter percentage point hike in May.
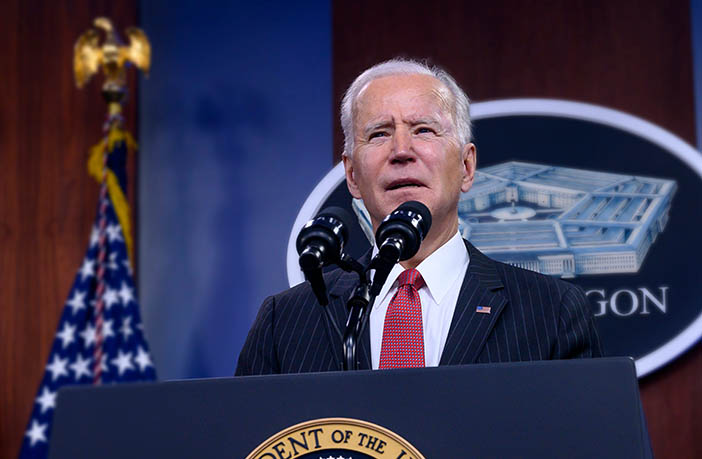
“This is a good jobs report for hard-working Americans. Today’s report shows that we continue to face economic challenges from a position of strength, with the economy adding 236,000 jobs last month and the unemployment rate at 3.5%. My economic agenda has powered a historic economic recovery” – part of President Joe Biden’s statement on March Job Reports.
Source: https://www.cnbc.com/2023/04/07/jobs-report-march-2023.html
That announcement caused turmoil in the financial markets, pushing crude prices up by the most in a year. That rally seems to have ended since the price is moving sideways showing minimal volatility. Did it really end? The market participants face quite an uncertainty due to the current market conditions.
“The surprise OPEC+ cuts have already triggered fears of a resurgence in inflation,” said Ryan Fitzmaurice, a lead index trader at commodities brokerages Marex Group Plc. “These renewed inflation concerns should only increase” in the months ahead, he said.
The production cuts don’t take effect until May. Oil demand typically reaches its seasonal peak during the 2nd half of the year in the U.S. meaning that demand kicks in during the summer months. The OPEC+ cut move might end up driving oil prices to $100 a barrel as demand surges. However, it may be the case that they do not expect demand to surge.
“While OPEC+ cuts on the surface are generally seen as bullish, it does also raise concerns over the demand outlook,” said Warren Patterson, head of commodities strategy at ING. “If OPEC+ were confident in a strong demand outlook this year, would they really feel the need to cut supply?”
“The OPEC+ output cut certainly raises the possibility of $100 a barrel this year, although it is by no means a certainty,” said Harry Altham, an analyst at brokerage StoneX. “Demand-side weakness stemming from growth considerations is clearly taking a more prominent role.”
There’s been no sign of lower Russian output showing up in the one measure that matters to global crude markets despite the numerous announcements that Russia will cut production. Only postpones for next month.
“We are certainly not done with interest-rate hikes,” the Dutch central bank chief told the NRC newspaper in an interview. “Core inflation in the Eurozone is now almost 6%, and you can’t fight that with an interest rate of 3%.”
Knot was asked if a rate cut toward the end of the year was thinkable for the Euro area, Knot described such a scenario as “almost impossible.” “Even if we have reached an interest rate level here that we are convinced will bring inflation back to 2% in the medium term, we may well have to keep interest rates at that peak level for a long time”, he said.
______________________________________________________________________
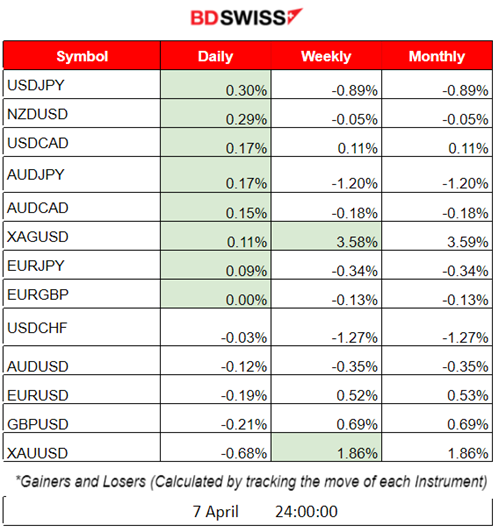
Summary Daily Moves – Winners vs Losers (07 April 2023)
Gold suffered the most losses with -a 0.68% price change.
______________________________________________________________________
News Reports Monitor – Previous Trading Day (07 April 2023)
Server Time / Timezone EEST (UTC+03:00)
- Midnight – Night Session (Asian)
No significant news. No important scheduled releases.
- Morning – Day Session (European)
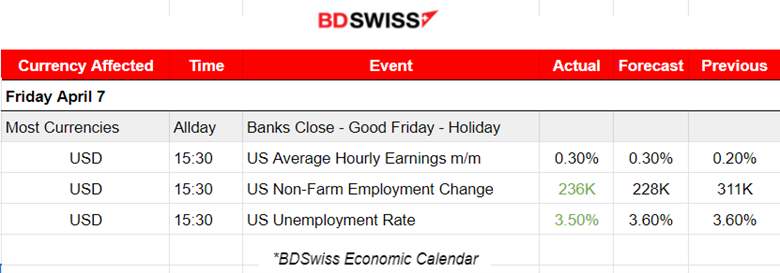
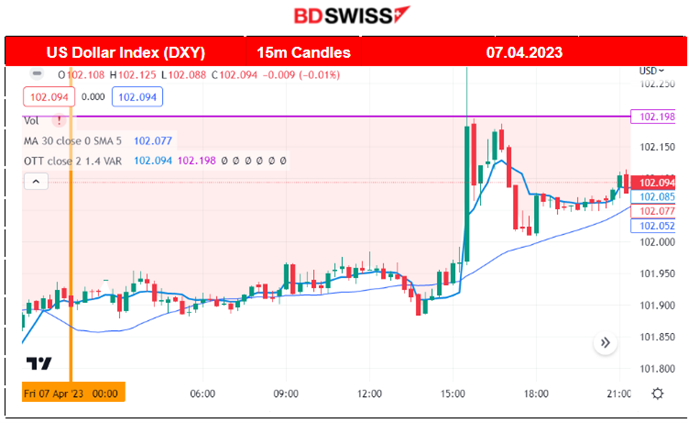
At 15:30, U.S. important figure releases took place that had a great impact on the USD and the financial markets in general. The Non-Farm Employment Change was reported at 236K, slightly more than expected, and the Unemployment Rate figure was reported at 3.5%. The monthly U.S. Average Hourly Earnings increased by 0.3% as expected.
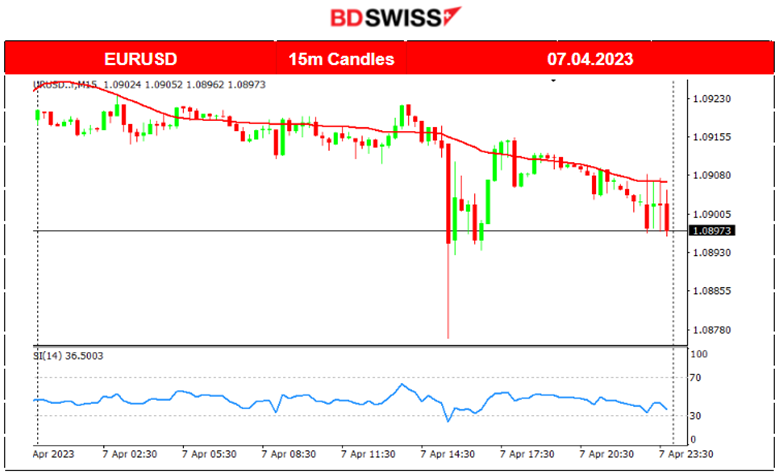
At the time of the figure release, the market reacted with USD dollar appreciation, an intraday shock, before the price returned. It caused unusual volatility in general that was later returned back to normal levels.
General Verdict:
______________________________________________________________________
FOREX MARKETS MONITOR
EURUSD 4-Day Chart Summary
Server Time / Timezone EEST (UTC+03:00)
Price Movement
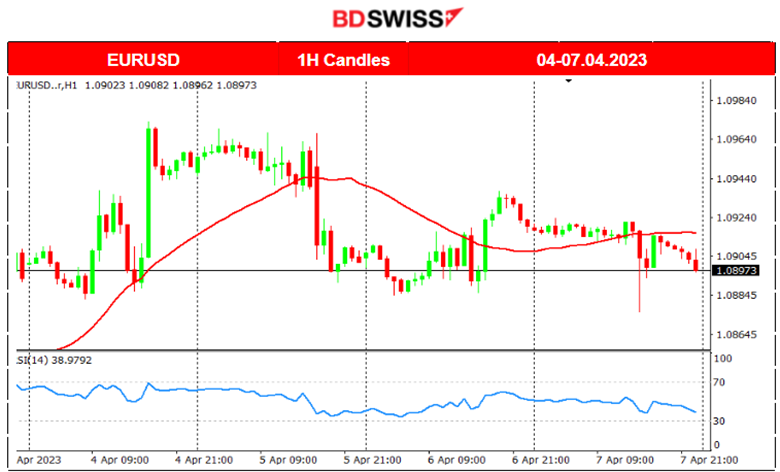
EURUSD was experiencing a quite volatile path the last few days with the release of very important figures and reports affecting the USD. A reversal downwards occurred on the 5th of April and then another on the 6th of April, signalling that volatility was getting lower ahead of NFP. 1.088 is significant support that the price did not break fully (leaving a candlestick shadow) with the NFP release. Looking at the EURUSD chart from a distance, it is clear that a head and shoulders pattern emerged, with the neckline taking place at that level. The below chart shows the head and the right shoulder. If the EURUSD eventually moves lower, it might break these significant support levels and further drop.
EURUSD (07.04.2023) Chart Summary
Server Time / Timezone EEST (UTC+03:00)
Price Movement
The EURUSD path in this chart is very similar to the opposite of the DXY as the USD is the main driver. Volatility was really low during the Asian and European sessions since the market was waiting for the NFP. After the report, the EURUSD dropped due to the USD depreciation. This intraday shock caused volatile market conditions with the price moving in both directions. The retracement happened quite fast with the price returning back to the mean fully. The pair moved slightly downwards for the rest of the trading day.
____________________________________________________________________
EQUITY MARKETS MONITOR
NAS100 (NASDAQ – NDX) 4-Day Chart Summary
Server Time / Timezone EEST (UTC+03:00)
Price Movement
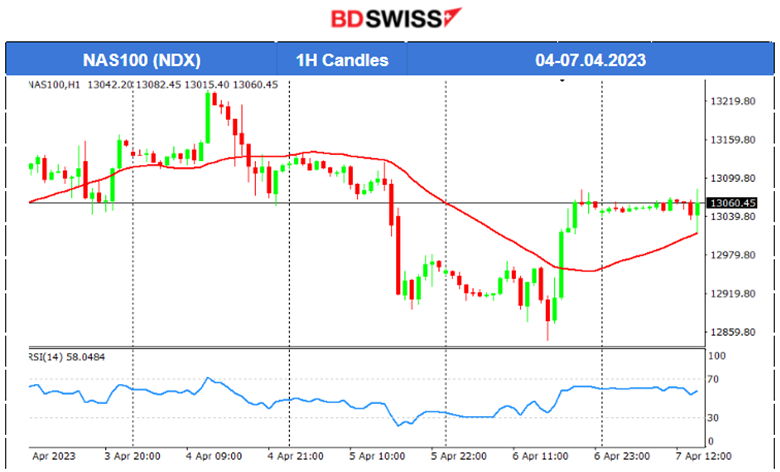
Reassuring comments and actions by the U.S. government regarding the recent banking crisis triggered the risk-on mood for a while. However, on the 4th of April, with the lower-than-expected U.S. JOLTS Job Openings report, NAS100 moved lower and crossed the 30-period MA signalling the end of the upward trend that took form some days ago. Fears of a recession are taking place as it is believed more and more that the turmoil in the banking system triggered by the collapse of the Silicon Valley Bank in March will lead to tight credit conditions and lower growth. Stocks moved lower until the 6th of April, 1 day before the U.S. Non-Farm Payrolls release, when the price eventually reversed right after the NYSE opening, crossing above the MA and moving rapidly upwards. For NAS100 CFD the market was open, however, its price did not move much during the day, remaining higher, closing at 13060 USD.
______________________________________________________________________
COMMODITIES MARKETS MONITOR
USOIL (WTI) 4-Day Chart Summary
Server Time / Timezone EEST (UTC+03:00)
Price Movement
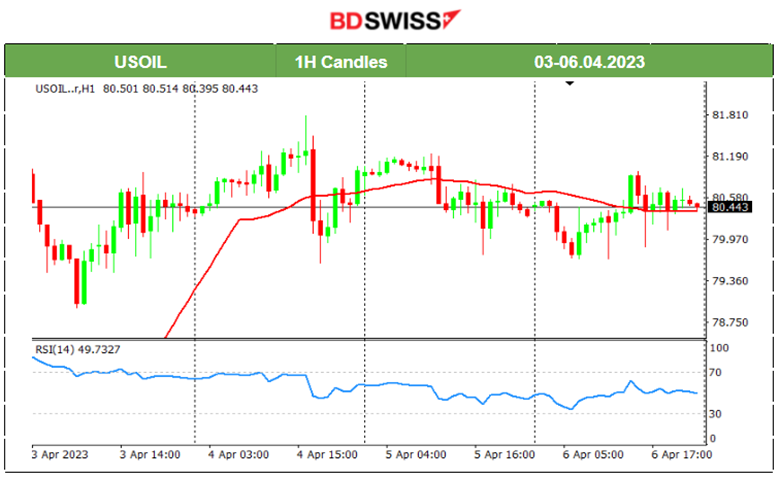
Crude’s price has been moving sideways after the OPEC+ announcements of production cuts that are expected to take effect in May. Given the limited supply by other producers and with still-growing demand despite the energy transition OPEC+ showed its power over the market in the short term. However, there are no lasting effects of the announcements. Price is moving around the 30-period MA for days near the mean price of 80.5 USD/barrel without deviating significantly. Max deviation near 1 USD from the mean. As May approaches, the real effect might start to take place.
XAUUSD (Gold) 4-Day Chart Summary
Server Time / Timezone EEST (UTC+03:00)
Price Movement
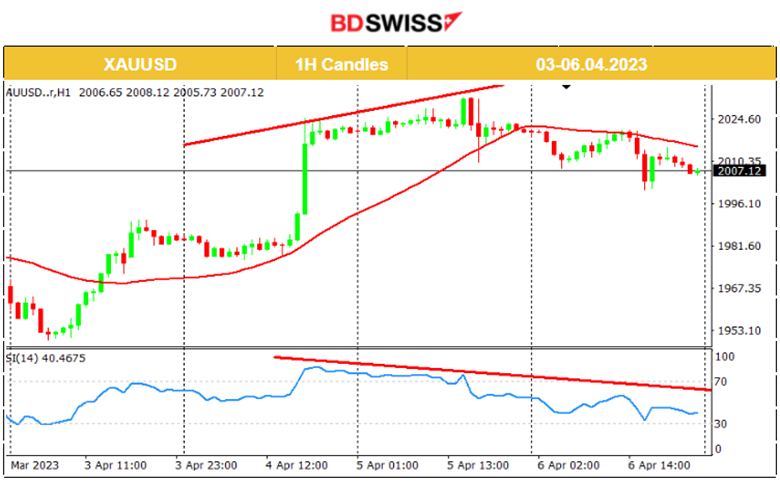
Gold moved higher in the last few days, as investors shifted their preferences over metals instead of risky assets, such as stocks. Its price is also affected by the USD. JOLTS Job Openings on the 4th of April caused it to jump since the USD depreciated heavily. On the 6th of April, it experienced a price reversal, crossed the 30-period MA moving downwards, signalling the end of the short-term upward movement, and continued its sideways movement below the MA. The RSI had lower highs while the price had higher highs, thus signalling the price reversal.
On the 7th of April, Good Friday, the market was closed for Gold CFD.
______________________________________________________________
News Reports Monitor – Today Trading Day (07 April 2023)
Server Time / Timezone EEST (UTC+03:00)

- Midnight – Night Session (Asian)
No significant news. No important scheduled releases.
- Morning – Day Session (European)
No significant news or any important scheduled releases. Banks will be closed in observance of Easter Monday.
International Monetary Fund Meetings (IMF) are going to take place the whole week starting from the 10th of April.
These meetings are usually held twice a year and are attended by the representatives of the IMF and the World Bank. The press is attending the meetings and officials usually talk with reporters during the day when it takes place. The comments and statements that are released when the meeting is concluded can create non-typical market volatility.
General Verdict:
______________________________________________________________


